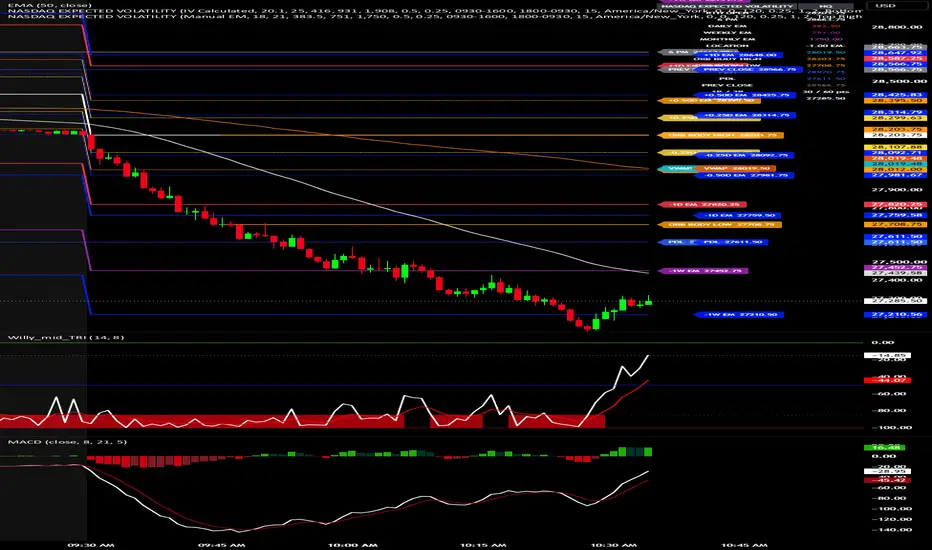
NASDAQ EXPECTED VOLATILITY
NQ
AI Overview
The Nasdaq-100 30-day implied volatility sits around 22.1%, while near-term market expectations and broader sentiment have spiked sharply as the Nasdaq Composite tumbled 5.52% to 24,315.00 amid a tech and chip stock sell-off following recent midterm election results.
Key Nasdaq Volatility Metrics
• Nasdaq-100 Implied Volatility (NDX IV): Approximately 22.1% for 30-day options, while at-the-money options for near-term expirations have traded around 26.3%.
• Cboe NASDAQ-100 Volatility Index (VXN): Measures the market's expectation of 30-day volatility derived from Nasdaq-100 option prices.
• Nasdaq-100 Volatility Index (VOLQ): Tracks 30-day implied volatility using an at-the-money focused selection of Nasdaq-100 options.
• GARCH Volatility Forecast: Long-run and near-term GARCH models for the Nasdaq Composite project a baseline volatility around 21.9% to 22.1%, with shock decays tracking a 52-trading-day half-life.
• Market Context: The broader Cboe Volatility Index (VIX) surged roughly 50% to 24.98 as the Nasdaq entered correction territory, dropping more than 10% from its early-October highs.
AI Overview
The Nasdaq-100 30-day implied volatility sits around 22.1%, while near-term market expectations and broader sentiment have spiked sharply as the Nasdaq Composite tumbled 5.52% to 24,315.00 amid a tech and chip stock sell-off following recent midterm election results.
Key Nasdaq Volatility Metrics
• Nasdaq-100 Implied Volatility (NDX IV): Approximately 22.1% for 30-day options, while at-the-money options for near-term expirations have traded around 26.3%.
• Cboe NASDAQ-100 Volatility Index (VXN): Measures the market's expectation of 30-day volatility derived from Nasdaq-100 option prices.
• Nasdaq-100 Volatility Index (VOLQ): Tracks 30-day implied volatility using an at-the-money focused selection of Nasdaq-100 options.
• GARCH Volatility Forecast: Long-run and near-term GARCH models for the Nasdaq Composite project a baseline volatility around 21.9% to 22.1%, with shock decays tracking a 52-trading-day half-life.
• Market Context: The broader Cboe Volatility Index (VIX) surged roughly 50% to 24.98 as the Nasdaq entered correction territory, dropping more than 10% from its early-October highs.

Haftungsausschluss
Die Informationen und Veröffentlichungen sind nicht als Finanz-, Anlage-, Handels- oder andere Arten von Ratschlägen oder Empfehlungen gedacht, die von TradingView bereitgestellt oder gebilligt werden, und stellen diese nicht dar. Lesen Sie mehr in den Nutzungsbedingungen.
Haftungsausschluss
Die Informationen und Veröffentlichungen sind nicht als Finanz-, Anlage-, Handels- oder andere Arten von Ratschlägen oder Empfehlungen gedacht, die von TradingView bereitgestellt oder gebilligt werden, und stellen diese nicht dar. Lesen Sie mehr in den Nutzungsbedingungen.