Session Percentile Oscillator + OI Context
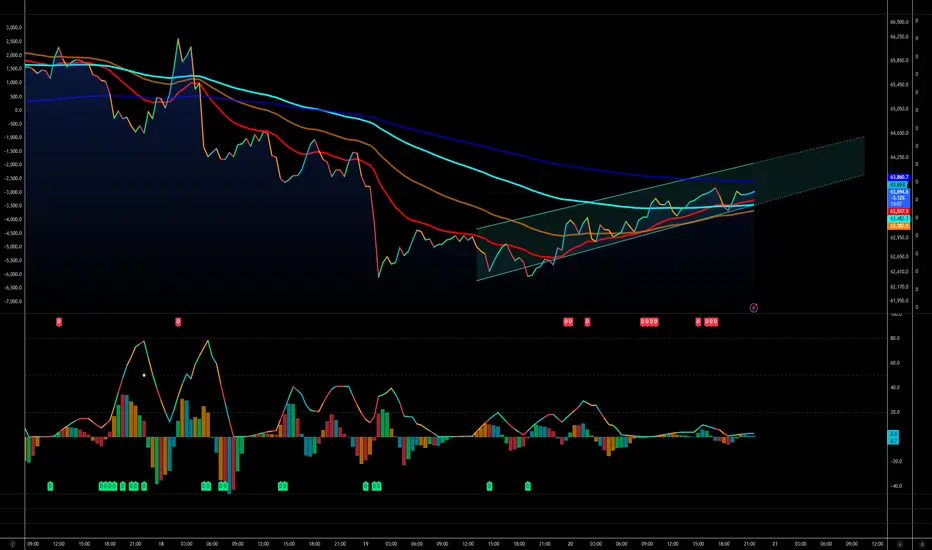
# Session Percentile Oscillator with OI Context
The Session Percentile Oscillator measures how much the current trading session has expanded relative to historical sessions of the same type (Asia, London, New York AM, Lunch, and New York PM).
Instead of looking at raw volatility, the indicator normalizes each session's range by ATR and compares it against historical observations. The result is a percentile score between 0 and 100.
A reading of:
* 20 means the current session is larger than only 20% of comparable historical sessions.
* 80 means the current session is larger than 80% of comparable historical sessions.
* 95 means the current session is larger than 95% of comparable historical sessions.
The goal is not to predict direction, but to measure how much effort is entering the market.
## OI Context Engine
The percentile line and velocity histogram are colored using aggregated Open Interest data collected from multiple derivatives exchanges.
The indicator combines:
* Aggregated Open Interest
* Volume Delta (CVD)
* OBV
* Price direction
to classify activity into:
* Green = Long building
* Red = Short building
* Aqua = Short covering
* Blue = Aggressive short squeeze
* Orange = Long liquidation
Unlike traditional OI indicators, mixed conditions are resolved using a probability engine and price/OI fallback logic, which prevents neutral gray states and keeps market positioning easier to read.
## Percentile Velocity Histogram
The histogram below the oscillator represents percentile velocity.
It measures how quickly the session percentile is changing.
* Positive values indicate expanding effort.
* Negative values indicate fading effort.
This is often useful for spotting acceleration before price fully reacts.
## ⚡ Effort Expansion
One of the key features of the indicator is the Effort Expansion warning.
The signal appears when the percentile slope is rising unusually fast compared to its own historical behavior.
Rather than using a fixed threshold, the indicator compares the current percentile slope against a rolling history and identifies situations where effort is expanding faster than normal.
The signal does not predict bullish or bearish direction.
It simply warns that market effort is increasing aggressively and that traders should pay closer attention to price structure, support/resistance, and OI context.
## D — Effort Divergence
The indicator can display effort divergences.
Bearish Divergence (D):
* Price makes a higher high.
* Percentile effort fails to make a higher high.
Bullish Divergence (D):
* Price makes a lower low.
* Percentile effort fails to make a lower low.
These signals can help identify weakening participation behind price extremes.
## E — Exhaustion / Absorption
The optional E marker appears when:
* Percentile effort remains elevated.
* Price produces little result.
This condition can indicate absorption, exhaustion, or inefficient effort where substantial market activity is producing limited directional progress.
## How To Use
The oscillator is best used as a market participation and effort tool.
Typical workflow:
1. Identify whether effort is expanding or contracting.
2. Use OI colors to understand who is likely driving the move.
3. Watch for ⚡ Effort Expansion events.
4. Use D and E markers to identify divergence or exhaustion.
5. Use price action and market structure to determine direction.
The indicator is designed to answer a different question than traditional oscillators:
"How much effort is entering the market relative to what is normally observed during this session?"

Haftungsausschluss
Die Informationen und Veröffentlichungen sind nicht als Finanz-, Anlage-, Handels- oder andere Arten von Ratschlägen oder Empfehlungen gedacht, die von TradingView bereitgestellt oder gebilligt werden, und stellen diese nicht dar. Lesen Sie mehr in den Nutzungsbedingungen.
Haftungsausschluss
Die Informationen und Veröffentlichungen sind nicht als Finanz-, Anlage-, Handels- oder andere Arten von Ratschlägen oder Empfehlungen gedacht, die von TradingView bereitgestellt oder gebilligt werden, und stellen diese nicht dar. Lesen Sie mehr in den Nutzungsbedingungen.