Round Numbers with 3&8
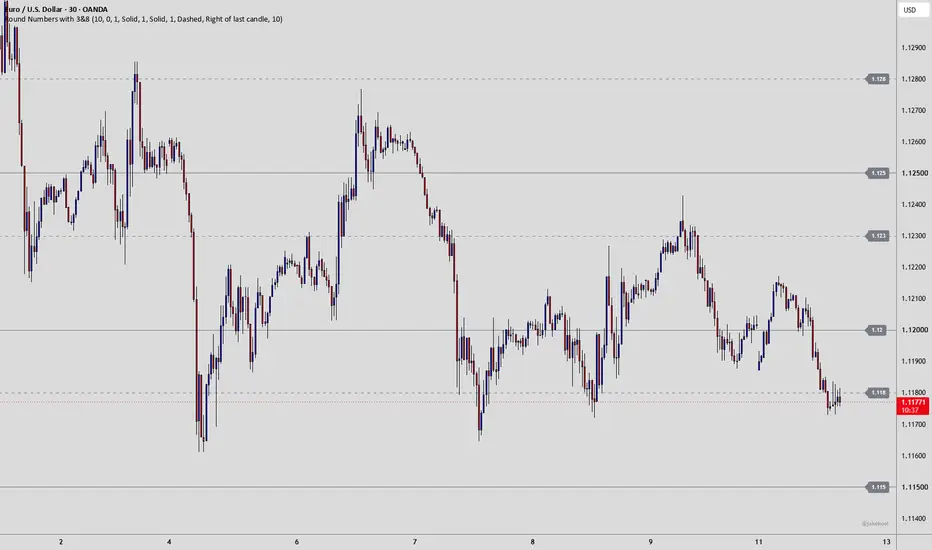
Round Numbers with 3&8 highlights the price levels that traders watch most: round numbers and the levels halfway between them. Optionally, it also adds 3 & 8 levels, which I use from my own trading experience.
It's a clean, informational tool: it draws the levels around current price and nothing else. No signals.
WHAT IT SHOWS
- Round numbers (always on): the main psychological levels.
- Mid levels (on by default): halfway between two round numbers.
- 3 & 8 levels (off by default, switch on in settings): the levels at 30% and 80% of the way between two round numbers.
Examples:
- EUR/USD: round numbers 1.1200 and 1.1300, mid level 1.1250, 3 & 8 levels 1.1230 and 1.1280.
- USD/JPY: round numbers 158.00 and 159.00, mid level 158.50, 3 & 8 levels 158.30 and 158.80.
- Gold: round numbers 4,000 and 5,000, mid level 4,500, 3 & 8 levels 4,300 and 4,800.
I use this indicator mainly on forex pairs, but it works on any market: gold, silver, oil, indices, crypto and more. The distance between round numbers is set automatically for each market:
- Forex: every 100 pips (0.01 on EUR/USD, 1.00 on yen pairs).
- Gold and S&P 500: every 1,000.
- Other markets: based on the price, e.g. US30 and Bitcoin every 1,000, silver every 1.
You can also set your own spacing in the settings.
WHY ROUND NUMBERS MATTER
Round numbers are psychological levels. Traders, banks and investors naturally think and place orders in round figures, so these levels attract a lot of interest, and price often reacts when it reaches them. This isn't only market folklore; research supports it:
- Traders favour round numbers. A Federal Reserve Bank of New York study of support and resistance levels published by trading firms found that around 70% ended in 0 and 96% ended in 0 or 5, far more than chance. Levels ending in 00 and 50 were especially common. Exchange rates also bounced off these published levels more often than off random levels, and part of that effect came from the round numbers themselves.
- Orders cluster around them. A second New York Fed study of real currency order data found that take-profit orders cluster exactly at round numbers, which helps explain why price often stalls or reverses there. Stop-loss orders cluster just beyond round numbers, so when a round number breaks, the triggered stops tend to speed the move up.
- It's not only forex. A study of the Dow Jones Industrial Average found that multiples of 100 acted as support and resistance, and that once the index broke through one, it tended to move further than it otherwise would have.
In practice, traders use round numbers as reference levels for entries, stop-losses and targets, and watch how price behaves when it reaches one: a rejection, or a clean break that may extend the move.
3 & 8 LEVELS (MY PERSONAL EXPERIENCE)
The 3 & 8 levels come from my own experience of watching, analysing and trading the forex market for many years, not from academic research. I've found that price often reacts well around the 3 and 8 levels on forex pairs (for example 1.1230 and 1.1280 on EUR/USD), and I use them for entries, targets and exit zones.
I also often treat the space between a 3 or 8 level and the nearest round number as a zone rather than a single line. For example, between 1.1280 and 1.1300, or between 1.1200 and 1.1230. This creates a 20 to 30 pip zone where, in my experience, the market has often reacted well historically.
The 3 & 8 levels are switched off by default. If you share this view or want to test it, switch them on in the settings.
SETTINGS
- Lines to show: how many levels are drawn around price, half below and half above (up to 20).
- Show mid levels: halfway levels on or off.
- Show 3 & 8 levels: on or off (off by default).
- Level spacing (0 = automatic): the distance between round numbers in price. Leave it at 0 for automatic spacing, or enter your own value, e.g. 0.005 for 50-pip spacing on EUR/USD or 10 for $10 spacing on oil.
- Round numbers / Mid levels / 3 & 8 levels: colour, width and style (solid, dashed or dotted) for each type, so you can match light or dark charts.
- Labels:
– Show price labels: on or off.
– Position: on the price scale, or a chosen number of bars to the right of the last candle (up to 500).
– Label text colour.
NOTES
- Levels update automatically as price moves.
- If price-scale labels make the chart's vertical zoom too wide on low timeframes, switch labels to "Right of last candle" or tick "Scale price chart only" in TradingView's chart settings.
- This is an analysis tool, not a buy or sell signal. Use it alongside your own analysis and risk management.
It's a clean, informational tool: it draws the levels around current price and nothing else. No signals.
WHAT IT SHOWS
- Round numbers (always on): the main psychological levels.
- Mid levels (on by default): halfway between two round numbers.
- 3 & 8 levels (off by default, switch on in settings): the levels at 30% and 80% of the way between two round numbers.
Examples:
- EUR/USD: round numbers 1.1200 and 1.1300, mid level 1.1250, 3 & 8 levels 1.1230 and 1.1280.
- USD/JPY: round numbers 158.00 and 159.00, mid level 158.50, 3 & 8 levels 158.30 and 158.80.
- Gold: round numbers 4,000 and 5,000, mid level 4,500, 3 & 8 levels 4,300 and 4,800.
I use this indicator mainly on forex pairs, but it works on any market: gold, silver, oil, indices, crypto and more. The distance between round numbers is set automatically for each market:
- Forex: every 100 pips (0.01 on EUR/USD, 1.00 on yen pairs).
- Gold and S&P 500: every 1,000.
- Other markets: based on the price, e.g. US30 and Bitcoin every 1,000, silver every 1.
You can also set your own spacing in the settings.
WHY ROUND NUMBERS MATTER
Round numbers are psychological levels. Traders, banks and investors naturally think and place orders in round figures, so these levels attract a lot of interest, and price often reacts when it reaches them. This isn't only market folklore; research supports it:
- Traders favour round numbers. A Federal Reserve Bank of New York study of support and resistance levels published by trading firms found that around 70% ended in 0 and 96% ended in 0 or 5, far more than chance. Levels ending in 00 and 50 were especially common. Exchange rates also bounced off these published levels more often than off random levels, and part of that effect came from the round numbers themselves.
- Orders cluster around them. A second New York Fed study of real currency order data found that take-profit orders cluster exactly at round numbers, which helps explain why price often stalls or reverses there. Stop-loss orders cluster just beyond round numbers, so when a round number breaks, the triggered stops tend to speed the move up.
- It's not only forex. A study of the Dow Jones Industrial Average found that multiples of 100 acted as support and resistance, and that once the index broke through one, it tended to move further than it otherwise would have.
In practice, traders use round numbers as reference levels for entries, stop-losses and targets, and watch how price behaves when it reaches one: a rejection, or a clean break that may extend the move.
3 & 8 LEVELS (MY PERSONAL EXPERIENCE)
The 3 & 8 levels come from my own experience of watching, analysing and trading the forex market for many years, not from academic research. I've found that price often reacts well around the 3 and 8 levels on forex pairs (for example 1.1230 and 1.1280 on EUR/USD), and I use them for entries, targets and exit zones.
I also often treat the space between a 3 or 8 level and the nearest round number as a zone rather than a single line. For example, between 1.1280 and 1.1300, or between 1.1200 and 1.1230. This creates a 20 to 30 pip zone where, in my experience, the market has often reacted well historically.
The 3 & 8 levels are switched off by default. If you share this view or want to test it, switch them on in the settings.
SETTINGS
- Lines to show: how many levels are drawn around price, half below and half above (up to 20).
- Show mid levels: halfway levels on or off.
- Show 3 & 8 levels: on or off (off by default).
- Level spacing (0 = automatic): the distance between round numbers in price. Leave it at 0 for automatic spacing, or enter your own value, e.g. 0.005 for 50-pip spacing on EUR/USD or 10 for $10 spacing on oil.
- Round numbers / Mid levels / 3 & 8 levels: colour, width and style (solid, dashed or dotted) for each type, so you can match light or dark charts.
- Labels:
– Show price labels: on or off.
– Position: on the price scale, or a chosen number of bars to the right of the last candle (up to 500).
– Label text colour.
NOTES
- Levels update automatically as price moves.
- If price-scale labels make the chart's vertical zoom too wide on low timeframes, switch labels to "Right of last candle" or tick "Scale price chart only" in TradingView's chart settings.
- This is an analysis tool, not a buy or sell signal. Use it alongside your own analysis and risk management.

Haftungsausschluss
Die Informationen und Veröffentlichungen sind nicht als Finanz-, Anlage-, Handels- oder andere Arten von Ratschlägen oder Empfehlungen gedacht, die von TradingView bereitgestellt oder gebilligt werden, und stellen diese nicht dar. Lesen Sie mehr in den Nutzungsbedingungen.
Haftungsausschluss
Die Informationen und Veröffentlichungen sind nicht als Finanz-, Anlage-, Handels- oder andere Arten von Ratschlägen oder Empfehlungen gedacht, die von TradingView bereitgestellt oder gebilligt werden, und stellen diese nicht dar. Lesen Sie mehr in den Nutzungsbedingungen.