Call Checker: Real Result After Fees
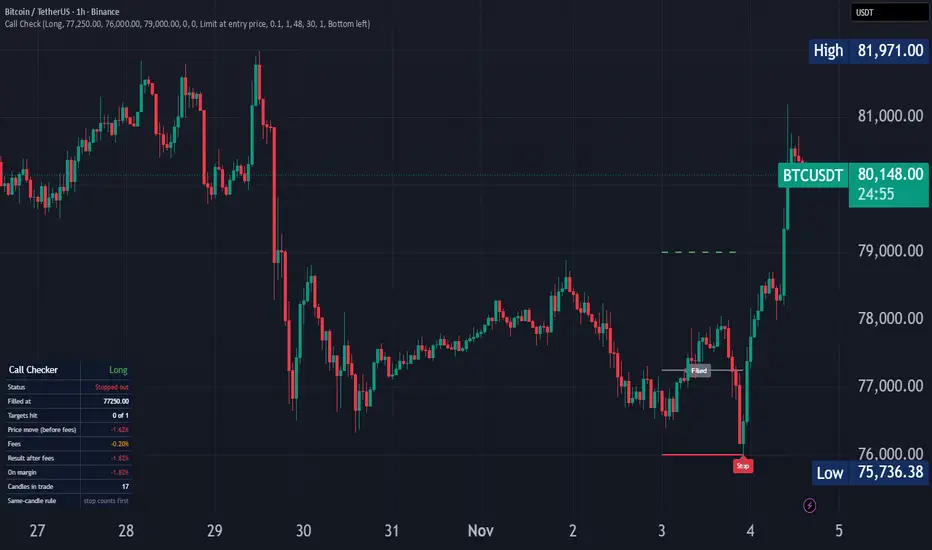
Call Checker replays one trade call (the kind posted in signal channels, newsletters or chats) against the chart's actual candles and shows what it would really have returned after fees.
Screenshots of "TP1 hit" rarely tell you whether the entry ever filled, whether the stop was hit first, or what fees and leverage did to the result. This script answers those questions for a single call, candle by candle.
HOW TO USE
- Add the script to a chart of the coin the call was for.
- TradingView asks you to click four things: the candle when the call was posted, then the entry, stop loss and Target 1 prices.
- Optional: open the settings to type exact prices, add Target 2 and Target 3, and set leverage, fees and the side (Long or Short).
- The results table shows the outcome. Lines mark the entry, stop, targets and (with leverage) an approximate liquidation price.
WHAT THE TABLE SHOWS
- Status: Still open, All targets hit, Stopped out, Stopped after TP1/TP2, Liquidated, Not filled, or Closed after the time limit
- Filled at: the entry price actually used
- Targets hit
- Price move before fees, Fees, and Result after fees
- On margin: the result multiplied by leverage, capped at -100%
- Candles in trade
- Same-candle rule: how a candle that touched both the stop and a target was settled
HOW IT COUNTS
- Entry: "Limit at entry price" (default) counts the trade only once price actually trades at the entry, within the fill window (48 hours by default). Otherwise the call is "Not filled" and the result is 0%. "Market at call time" fills at the open of the call candle.
- Targets: the position is split evenly across the targets you enter. Each target closes its share, in order (TP2 needs TP1 first).
- Stop: closes whatever is still open. A stop after a target counts as "Stopped after TP".
- Same candle: if one candle touches both the stop and the next target, the script looks at lower-timeframe candles (1 minute by default) to see which came first. If that data isn't available, the stop counts, because that is the worse outcome.
- Fill candle: on the candle where a limit entry fills, targets are not counted (price may have touched them before the fill), but the stop is.
- Fees: charged on the entry and on every exit (0.1% per side by default).
- Leverage: above 1x, an approximate liquidation price is checked before the stop when it sits closer to the entry. Maintenance margin and funding are ignored, so a real liquidation can come earlier.
- Time limit: anything still open after 30 days (adjustable) is closed at that candle's close.
THE EXAMPLE ON THE CHART
A long call on BTCUSDT (1 hour), posted Nov 3: entry 77,250, stop 76,000, Target 1 79,000. The entry filled, but price dipped to the stop before it reached the target. Result: -1.62% price move, -0.20% fees, -1.82% after fees. A "results" post that only shows the later rally would never show this loss.
LIMITATIONS
- One call at a time. To check a whole channel, check its calls one by one.
- Results depend on the exchange feed on your chart. Wicks and fills differ between exchanges.
- Slippage and funding rates are not included.
- If the call time is earlier than the first candle loaded on the chart, the table says so. Switch to a higher timeframe or scroll back.
This is an educational tool for checking past trade calls. It is not financial advice and does not generate signals.
Screenshots of "TP1 hit" rarely tell you whether the entry ever filled, whether the stop was hit first, or what fees and leverage did to the result. This script answers those questions for a single call, candle by candle.
HOW TO USE
- Add the script to a chart of the coin the call was for.
- TradingView asks you to click four things: the candle when the call was posted, then the entry, stop loss and Target 1 prices.
- Optional: open the settings to type exact prices, add Target 2 and Target 3, and set leverage, fees and the side (Long or Short).
- The results table shows the outcome. Lines mark the entry, stop, targets and (with leverage) an approximate liquidation price.
WHAT THE TABLE SHOWS
- Status: Still open, All targets hit, Stopped out, Stopped after TP1/TP2, Liquidated, Not filled, or Closed after the time limit
- Filled at: the entry price actually used
- Targets hit
- Price move before fees, Fees, and Result after fees
- On margin: the result multiplied by leverage, capped at -100%
- Candles in trade
- Same-candle rule: how a candle that touched both the stop and a target was settled
HOW IT COUNTS
- Entry: "Limit at entry price" (default) counts the trade only once price actually trades at the entry, within the fill window (48 hours by default). Otherwise the call is "Not filled" and the result is 0%. "Market at call time" fills at the open of the call candle.
- Targets: the position is split evenly across the targets you enter. Each target closes its share, in order (TP2 needs TP1 first).
- Stop: closes whatever is still open. A stop after a target counts as "Stopped after TP".
- Same candle: if one candle touches both the stop and the next target, the script looks at lower-timeframe candles (1 minute by default) to see which came first. If that data isn't available, the stop counts, because that is the worse outcome.
- Fill candle: on the candle where a limit entry fills, targets are not counted (price may have touched them before the fill), but the stop is.
- Fees: charged on the entry and on every exit (0.1% per side by default).
- Leverage: above 1x, an approximate liquidation price is checked before the stop when it sits closer to the entry. Maintenance margin and funding are ignored, so a real liquidation can come earlier.
- Time limit: anything still open after 30 days (adjustable) is closed at that candle's close.
THE EXAMPLE ON THE CHART
A long call on BTCUSDT (1 hour), posted Nov 3: entry 77,250, stop 76,000, Target 1 79,000. The entry filled, but price dipped to the stop before it reached the target. Result: -1.62% price move, -0.20% fees, -1.82% after fees. A "results" post that only shows the later rally would never show this loss.
LIMITATIONS
- One call at a time. To check a whole channel, check its calls one by one.
- Results depend on the exchange feed on your chart. Wicks and fills differ between exchanges.
- Slippage and funding rates are not included.
- If the call time is earlier than the first candle loaded on the chart, the table says so. Switch to a higher timeframe or scroll back.
This is an educational tool for checking past trade calls. It is not financial advice and does not generate signals.

Haftungsausschluss
Die Informationen und Veröffentlichungen sind nicht als Finanz-, Anlage-, Handels- oder andere Arten von Ratschlägen oder Empfehlungen gedacht, die von TradingView bereitgestellt oder gebilligt werden, und stellen diese nicht dar. Lesen Sie mehr in den Nutzungsbedingungen.
Haftungsausschluss
Die Informationen und Veröffentlichungen sind nicht als Finanz-, Anlage-, Handels- oder andere Arten von Ratschlägen oder Empfehlungen gedacht, die von TradingView bereitgestellt oder gebilligt werden, und stellen diese nicht dar. Lesen Sie mehr in den Nutzungsbedingungen.