OPEN-SOURCE SCRIPT
Aktualisiert Daily MAs on Intraday Charts (Indian Market)
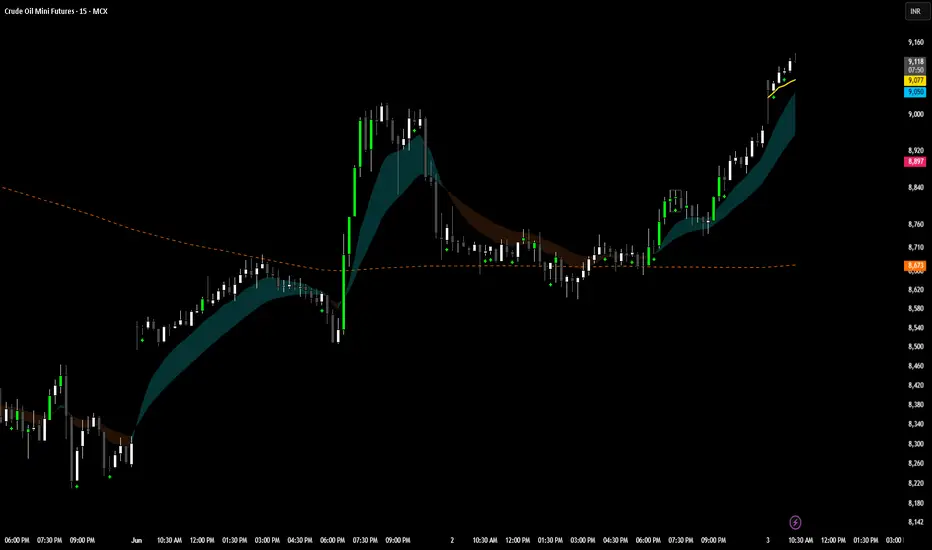
Daily Moving Averages + VWAP — Indian Market (NSE/BSE)
A comprehensive intraday analysis tool built exclusively for the **Indian stock markets (NSE & BSE)**. This indicator combines key Daily Moving Averages with a session-aware VWAP, all plotted directly on intraday charts — giving you a complete picture of where price stands relative to the most important daily levels without ever having to switch timeframes.
---
**⚙️ How It Works**
The Indian cash market trades for exactly **375 minutes per day** (9:15 AM – 3:30 PM IST). This indicator uses that fixed session length to dynamically back-calculate the exact number of intraday bars required to replicate each Daily Moving Average on any lower timeframe. Whether you are on a 1-minute or a 125-minute chart, every MA will always reflect its true daily value — no manual input or reconfiguration required when switching timeframes.
---
**📈 Moving Averages Plotted**
| MA | Type | Colour |
|---|---|---|
| 5 Day | SMA | White |
| 10 Day | EMA | Sky Blue |
| 21 Day | EMA | Green |
| 50 Day | EMA | Orange |
The **5 SMA** acts as a short-term trend filter and is widely tracked by momentum traders. The **10 and 21 EMAs** are key levels for swing and positional traders, offering dynamic near-term support and resistance. The **50 EMA** represents the medium-term trend and is one of the most watched levels by institutional traders in the Indian markets.
---
**🕐 Supported Timeframes**
The indicator automatically calculates the correct bar period for all intraday timeframes, including **1 min, 3 min, 5 min, 15 min, 25 min, 75 min, 125 min**, and any other intraday interval. It also works natively on the **Daily** and **Weekly** timeframes.
> ⚠️ TradingView imposes a **5,000 bar limit** on historical data. As a result, MAs that require more bars than this limit on lower timeframes will display **"Insuf. Data"** in the table and will not plot on the chart. The affected MAs vary by timeframe as follows:
> - **1 min** — only 5 SMA and 10 EMA are available
> - **3 min** — 5 SMA, 10 EMA and 21 EMA are available
> - **5 min and above** — all four MAs plot fully
---
**📊 VWAP**
The indicator includes a fully session-aware **Volume Weighted Average Price (VWAP)** plotted in purple. VWAP is one of the most widely used intraday benchmarks by institutional desks, prop traders, and retail participants alike, offering a real-time view of the average price weighted by volume traded during the session.
Two modes are available via the settings:
- **Historical VWAP on** — Plots TradingView's built-in VWAP continuously across all visible sessions, allowing you to study how price behaved relative to VWAP on previous days
- **Historical VWAP off** — Acts as a true **Anchored VWAP**, anchored strictly to the **9:15 AM first candle of the current trading day**. All previous session VWAP lines are completely hidden, keeping the chart clean and focused on today's session only
---
**🧮 Distance Table**
An on-chart table displays the **live percentage distance of the current price from each MA and VWAP** in real time. This tells you at a glance how extended or compressed the price is relative to each key level.
- 🟢 **Green** — price is trading above the level
- 🔴 **Red** — price is trading below the level
- ⚫ **Grey / "Insuf. Data"** — insufficient historical bars to calculate the MA on the current timeframe
The table can be toggled on or off and repositioned to any of **9 positions** on the chart — top, middle, or bottom, aligned left, center, or right — so it never interferes with your price action.
---
**🛠️ Settings**
| Setting | Description |
|---|---|
| Show Distance Table | Toggle the MA and VWAP distance table on or off |
| Label Position | Place the table in any of 9 positions on the chart |
| Show VWAP | Toggle the VWAP line and its table row on or off |
| Show Historical VWAP | When on, shows VWAP across all sessions. When off, anchors VWAP to today's 9:15 AM candle only |
---
**⚠️ Important — Indian Markets Only**
This indicator is **specifically calibrated for the Indian stock markets (NSE/BSE)** and is **not suitable for use on any other global market**. The period calculation is hardcoded to **375 minutes per trading day**, which is unique to the Indian cash market session. Applying this indicator to markets with different session lengths — such as US markets (390 minutes), European markets, or 24-hour crypto markets — will cause all Moving Averages to drift significantly from their true daily values and produce incorrect readings.
---
*Built for Indian intraday, swing, and positional traders who trade with full awareness of key daily levels and session VWAP dynamics.*
A comprehensive intraday analysis tool built exclusively for the **Indian stock markets (NSE & BSE)**. This indicator combines key Daily Moving Averages with a session-aware VWAP, all plotted directly on intraday charts — giving you a complete picture of where price stands relative to the most important daily levels without ever having to switch timeframes.
---
**⚙️ How It Works**
The Indian cash market trades for exactly **375 minutes per day** (9:15 AM – 3:30 PM IST). This indicator uses that fixed session length to dynamically back-calculate the exact number of intraday bars required to replicate each Daily Moving Average on any lower timeframe. Whether you are on a 1-minute or a 125-minute chart, every MA will always reflect its true daily value — no manual input or reconfiguration required when switching timeframes.
---
**📈 Moving Averages Plotted**
| MA | Type | Colour |
|---|---|---|
| 5 Day | SMA | White |
| 10 Day | EMA | Sky Blue |
| 21 Day | EMA | Green |
| 50 Day | EMA | Orange |
The **5 SMA** acts as a short-term trend filter and is widely tracked by momentum traders. The **10 and 21 EMAs** are key levels for swing and positional traders, offering dynamic near-term support and resistance. The **50 EMA** represents the medium-term trend and is one of the most watched levels by institutional traders in the Indian markets.
---
**🕐 Supported Timeframes**
The indicator automatically calculates the correct bar period for all intraday timeframes, including **1 min, 3 min, 5 min, 15 min, 25 min, 75 min, 125 min**, and any other intraday interval. It also works natively on the **Daily** and **Weekly** timeframes.
> ⚠️ TradingView imposes a **5,000 bar limit** on historical data. As a result, MAs that require more bars than this limit on lower timeframes will display **"Insuf. Data"** in the table and will not plot on the chart. The affected MAs vary by timeframe as follows:
> - **1 min** — only 5 SMA and 10 EMA are available
> - **3 min** — 5 SMA, 10 EMA and 21 EMA are available
> - **5 min and above** — all four MAs plot fully
---
**📊 VWAP**
The indicator includes a fully session-aware **Volume Weighted Average Price (VWAP)** plotted in purple. VWAP is one of the most widely used intraday benchmarks by institutional desks, prop traders, and retail participants alike, offering a real-time view of the average price weighted by volume traded during the session.
Two modes are available via the settings:
- **Historical VWAP on** — Plots TradingView's built-in VWAP continuously across all visible sessions, allowing you to study how price behaved relative to VWAP on previous days
- **Historical VWAP off** — Acts as a true **Anchored VWAP**, anchored strictly to the **9:15 AM first candle of the current trading day**. All previous session VWAP lines are completely hidden, keeping the chart clean and focused on today's session only
---
**🧮 Distance Table**
An on-chart table displays the **live percentage distance of the current price from each MA and VWAP** in real time. This tells you at a glance how extended or compressed the price is relative to each key level.
- 🟢 **Green** — price is trading above the level
- 🔴 **Red** — price is trading below the level
- ⚫ **Grey / "Insuf. Data"** — insufficient historical bars to calculate the MA on the current timeframe
The table can be toggled on or off and repositioned to any of **9 positions** on the chart — top, middle, or bottom, aligned left, center, or right — so it never interferes with your price action.
---
**🛠️ Settings**
| Setting | Description |
|---|---|
| Show Distance Table | Toggle the MA and VWAP distance table on or off |
| Label Position | Place the table in any of 9 positions on the chart |
| Show VWAP | Toggle the VWAP line and its table row on or off |
| Show Historical VWAP | When on, shows VWAP across all sessions. When off, anchors VWAP to today's 9:15 AM candle only |
---
**⚠️ Important — Indian Markets Only**
This indicator is **specifically calibrated for the Indian stock markets (NSE/BSE)** and is **not suitable for use on any other global market**. The period calculation is hardcoded to **375 minutes per trading day**, which is unique to the Indian cash market session. Applying this indicator to markets with different session lengths — such as US markets (390 minutes), European markets, or 24-hour crypto markets — will cause all Moving Averages to drift significantly from their true daily values and produce incorrect readings.
---
*Built for Indian intraday, swing, and positional traders who trade with full awareness of key daily levels and session VWAP dynamics.*
Versionshinweise
v2.0 — MCX Commodities Support + Market Toggles🆕 New Features
MCX Commodities
Added MCX 5 Day SMA specifically calibrated for Indian commodity markets
MCX session length selector with three options:
Summer — 870 minutes (9:00 AM – 11:30 PM IST)
Winter — 895 minutes (9:00 AM – 11:55 PM IST) accounting for Daylight Saving Time adjustments
Custom — manually enter any session length in minutes for edge cases
MCX 5 SMA auto-calculates the correct number of intraday bars for any timeframe using the selected session length, exactly mirroring how NSE MAs work but with MCX session timing
MCX 5 SMA plots in Yellow to visually distinguish it from NSE MAs
Table dynamically shows the active session length in the MCX row label e.g. MCX 5 SMA (870m) so the selected season is always visible at a glance
Market Master Toggles
Added NSE/BSE Equities master toggle — turns all four NSE MAs (5 SMA, 10 EMA, 21 EMA, 50 EMA) on or off with a single switch
Added MCX Commodities master toggle — turns the MCX 5 SMA on or off with a single switch
Four possible modes:
✅ NSE on / MCX off → Equity mode
✅ MCX on / NSE off → Commodities mode
✅ Both on → All MAs visible together
✅ Both off → Only VWAP remains
Table rows are cleanly cleared (not just hidden) when a market is toggled off so no stale values linger
Open-source Skript
Ganz im Sinne von TradingView hat dieser Autor sein/ihr Script als Open-Source veröffentlicht. Auf diese Weise können nun auch andere Trader das Script rezensieren und die Funktionalität überprüfen. Vielen Dank an den Autor! Sie können das Script kostenlos verwenden, aber eine Wiederveröffentlichung des Codes unterliegt unseren Hausregeln.

Haftungsausschluss
Die Informationen und Veröffentlichungen sind nicht als Finanz-, Anlage-, Handels- oder andere Arten von Ratschlägen oder Empfehlungen gedacht, die von TradingView bereitgestellt oder gebilligt werden, und stellen diese nicht dar. Lesen Sie mehr in den Nutzungsbedingungen.
Open-source Skript
Ganz im Sinne von TradingView hat dieser Autor sein/ihr Script als Open-Source veröffentlicht. Auf diese Weise können nun auch andere Trader das Script rezensieren und die Funktionalität überprüfen. Vielen Dank an den Autor! Sie können das Script kostenlos verwenden, aber eine Wiederveröffentlichung des Codes unterliegt unseren Hausregeln.
Haftungsausschluss
Die Informationen und Veröffentlichungen sind nicht als Finanz-, Anlage-, Handels- oder andere Arten von Ratschlägen oder Empfehlungen gedacht, die von TradingView bereitgestellt oder gebilligt werden, und stellen diese nicht dar. Lesen Sie mehr in den Nutzungsbedingungen.