OPEN-SOURCE SCRIPT
Aktualisiert Dynamic EMA Stack Support & Resistance
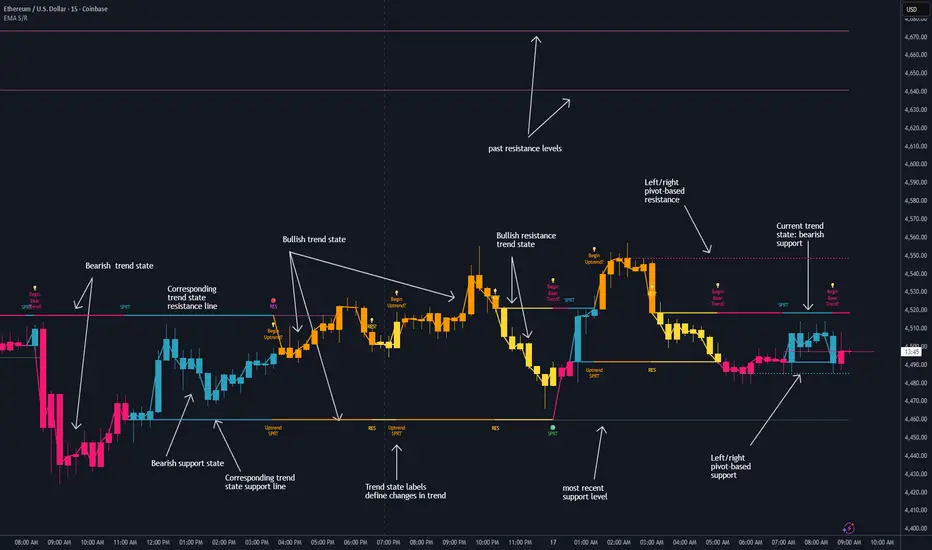
Every trader needs reliable support and resistance — but static zones and lagging indicators won't cut it in fast-moving markets. This script combines a Fibonacci-based 5-EMA stacking system and left/right pivots that create dynamic support & resistance logic to uncover real-time structural shifts & momentum zones that actually adapt to price action. This isn’t just a mashup — it’s a complete built-from-the-ground-up support & resistance engine designed for scalpers, intraday traders, and trend followers alike.
🧠 🧠 🧠What It Does🧠 🧠 🧠
This script uses two powerful engines working in sync:
1️⃣ EMA Stack (5-EMA Framework)
Built on Fibonacci-based lengths: 5, 8, 13, 21, 34, (configurable) this stack identifies:
🔹 Bullish Stack: EMAs aligned from fastest to slowest (uptrend confirmation)
🔹 Bearish Stack: EMAs aligned inversely (downtrend confirmation)
🟡 Narrowing Zones: When EMAs compress within ATR thresholds → possible breakout or reversal zone
🎯 Labels identify key transitions like:
✅"Begin Bear Trend?"
✅"Uptrend SPRT"
✅"RES?" (resistance test)
2️⃣ Pivot-Based Projection Engine
Using classic Left/Right Bar pivot logic, the script:
📌 Detects early-stage swing highs/lows before full confirmation
📈 Projects horizontal S/R lines that adapt to market structure
🔁 Keeps lines active until a new pivot replaces them
🧩 Syncs beautifully with EMA stack for confluence zones
🎯🎯🎯Key Features for Traders🎯🎯🎯
✅ Trend Detection
→ EMA order reveals real-time bias (bullish, bearish, compression)
✅ Dynamic S/R Zones
→ Historical support/resistance levels auto-draw and extend
✅ Smart Labeling
→ “SPRT”, “RES”, and “Trend?” labels for live context + testing logic
✅ Custom Candle Coloring
→ Choose from Bar Color or Full Candle Overlay modes
✅ Scalper & Swing Compatible
→ Use fast confirmations for scalping or stack consistency for longer trends
⚙️⚙️⚙️How to Use⚙️⚙️⚙️
✅Use Top/Bottom (trend state) Line Colors to quickly read trend conditions.
✅Use Pivot-based support/resistance projections to anticipate where price might pause or reverse.
✅Watch for yellow/blue zones to prepare for volatility shifts/reversals.
✅Combine with volume or momentum indicators for added confirmation.
📐📐📐Customization Options📐📐📐
✅EMA lengths (5, 8, 13, 21, 34) — fully configurable - try 21,34,55, 89, 144 for longer term trend states
✅Left/Right bar pivot settings (default: 21/5)
✅Label size, visibility, and color themes
✅Toggle line and label visibility for clean layouts
✅“Max Bars Back” to control how deep history is scanned safely
🛠🛠🛠Built-In Safeguards🛠🛠🛠
✅ATR-based filters to stabilize compression logic
✅Guarded lookback (max_bars_back) to avoid runtime errors
✅Works on any asset, any timeframe
🏁🏁🏁Final Word🏁🏁🏁
This script is not just a visual tool, it’s a complete trend and structure framework. Whether you're looking for clean trend alignment, dynamic support/resistance, or early warning labels, this system is tuned to help you react with confidence — not hindsight.
Rembember, no single indicator should be used in isolation. For best results, combine it with price action analysis, higher-timeframe context, and complementary tools like trendlines, moving averages etc Use it as part of a well-rounded trading approach to confirm setups — not to define them alone.
💡💡💡Turn logic into clarity. Structure into trades. And uncertainty into confidence.💡💡💡
🧠 🧠 🧠What It Does🧠 🧠 🧠
This script uses two powerful engines working in sync:
1️⃣ EMA Stack (5-EMA Framework)
Built on Fibonacci-based lengths: 5, 8, 13, 21, 34, (configurable) this stack identifies:
🔹 Bullish Stack: EMAs aligned from fastest to slowest (uptrend confirmation)
🔹 Bearish Stack: EMAs aligned inversely (downtrend confirmation)
🟡 Narrowing Zones: When EMAs compress within ATR thresholds → possible breakout or reversal zone
🎯 Labels identify key transitions like:
✅"Begin Bear Trend?"
✅"Uptrend SPRT"
✅"RES?" (resistance test)
2️⃣ Pivot-Based Projection Engine
Using classic Left/Right Bar pivot logic, the script:
📌 Detects early-stage swing highs/lows before full confirmation
📈 Projects horizontal S/R lines that adapt to market structure
🔁 Keeps lines active until a new pivot replaces them
🧩 Syncs beautifully with EMA stack for confluence zones
🎯🎯🎯Key Features for Traders🎯🎯🎯
✅ Trend Detection
→ EMA order reveals real-time bias (bullish, bearish, compression)
✅ Dynamic S/R Zones
→ Historical support/resistance levels auto-draw and extend
✅ Smart Labeling
→ “SPRT”, “RES”, and “Trend?” labels for live context + testing logic
✅ Custom Candle Coloring
→ Choose from Bar Color or Full Candle Overlay modes
✅ Scalper & Swing Compatible
→ Use fast confirmations for scalping or stack consistency for longer trends
⚙️⚙️⚙️How to Use⚙️⚙️⚙️
✅Use Top/Bottom (trend state) Line Colors to quickly read trend conditions.
✅Use Pivot-based support/resistance projections to anticipate where price might pause or reverse.
✅Watch for yellow/blue zones to prepare for volatility shifts/reversals.
✅Combine with volume or momentum indicators for added confirmation.
📐📐📐Customization Options📐📐📐
✅EMA lengths (5, 8, 13, 21, 34) — fully configurable - try 21,34,55, 89, 144 for longer term trend states
✅Left/Right bar pivot settings (default: 21/5)
✅Label size, visibility, and color themes
✅Toggle line and label visibility for clean layouts
✅“Max Bars Back” to control how deep history is scanned safely
🛠🛠🛠Built-In Safeguards🛠🛠🛠
✅ATR-based filters to stabilize compression logic
✅Guarded lookback (max_bars_back) to avoid runtime errors
✅Works on any asset, any timeframe
🏁🏁🏁Final Word🏁🏁🏁
This script is not just a visual tool, it’s a complete trend and structure framework. Whether you're looking for clean trend alignment, dynamic support/resistance, or early warning labels, this system is tuned to help you react with confidence — not hindsight.
Rembember, no single indicator should be used in isolation. For best results, combine it with price action analysis, higher-timeframe context, and complementary tools like trendlines, moving averages etc Use it as part of a well-rounded trading approach to confirm setups — not to define them alone.
💡💡💡Turn logic into clarity. Structure into trades. And uncertainty into confidence.💡💡💡
Versionshinweise
Took out 2 unnecessary inputs (hard-coded the color inputs instead) and made a couple of organizational changes in the Inputs UI. Look out for a PRO version of this script soon 💥
Versionshinweise
Switched out blue and yellow trend colors, so now bearish support = yellow and bullish resistance = blue. Configurable still. Also, I need to take this time to address what the "real-time close line" code is/does.
📌 Purpose of the Real-time Close Line Block
This section of the script draws a dynamic horizontal line at the current close price to provide clear visual alignment with potential support and resistance levels.
It has two configurable extensions:
-Left Extension (Historical Context) - Extends the current close line backward for a user-defined number of bars. This allows traders to immediately see how the most recent close aligns with price action in the lookback window.
Example: if the current close sits near a prior support or resistance zone, the left extension highlights that relationship without requiring manual visual scanning.
Right Extension (Forward Projection) - Extends the close line forward into upcoming bars for a user-defined number of bars. This acts as a “projection guide” so that traders can anticipate where support/resistance alignment will appear in the near term. It helps frame the close relative to expected chart movement without cluttering the entire chart with permanent horizontal lines.
✅ Why It Matters in Support/Resistance Analysis
Support and resistance levels are most useful when traders can quickly contextualize current price relative to historical structures.
The left extension emphasizes where the close is located within a lookback window → making it easier to spot immediate confluence with past price levels.
Versionshinweise
🟢 UPDATE OVERVIEWThis update modernizes the original Dynamic EMA Stack Support & Resistance script into a more flexible EMA stack framework.
The original version was built around a fixed 5-EMA stack. This version upgrades the engine into a dynamic 5–7 EMA active-array model with both Auto TF and Manual stack modes. In Auto TF mode, the script selects a timeframe-aware EMA stack automatically. In Manual mode, users can define their own EMA lengths, with optional Length 6 and Length 7 slots that can be turned off by setting them to 0.
The trend-state engine still focuses on EMA stack order, compression, support, and resistance behavior, but the internal structure is now cleaner and more adaptive across chart timeframes.
🟦 KEY ENGINE CHANGES
• Added Auto TF / Manual EMA Stack Mode
• Upgraded from fixed 5-EMA comparisons to a dynamic active EMA array
• Supports 5, 6, or 7 active EMAs without separate logic paths
• Measures compression from the active fastest EMA to the active slowest EMA
🟦 VISUAL STATE UPGRADES
The color engine now separates raw logic states from final visual states.
Base states remain clean for transition logic:
• Bullish Price State
• Bearish Price State
• Bullish Resistance State
• Bearish Support State
The script now also includes gated extreme states:
• Top Extreme
• Bottom Extreme
Extreme colors only appear during full bullish or bearish trend states. They do not override Bear Support or Bull Resistance transition colors. This keeps labels, candles, close trackers, and guide lines visually synchronized.
The intended visual sequence is now cleaner:
• Bear SPRT → Bear Fall → Bear Extreme
• Bull RES → Bull Rise → Top Extreme
🟦 OSCILLATOR ADDITION
A new internal oscillator is built from the active EMA stack spread.
The oscillator uses:
• Active fastest EMA minus active slowest EMA
• ATR normalization
• Tanh-style compression into a controlled range
• Optional smoothing
This oscillator powers the Top Extreme / Bottom Extreme visual states and also feeds the new oscillator-pivot S/R projection feature.
🟦 OSCILLATOR PIVOT S/R LINES
This update replaces the older left/right price-window pivot projection concept with SimpleCryptoLife’s OscillatorPivots library.
The script now detects structure pivots from the oscillator and projects matching support/resistance lines onto your chart.
• Confirmed oscillator peak = projected resistance
• Confirmed oscillator dip = projected support
• Pivot levels can anchor from Wicks or Closes
• Lines begin from the actual oscillator pivot bar
This adds a cleaner momentum-based structure layer instead of relying only on raw price-window highs/lows.
🟦 CANDLE AND GUIDE-LINE CLEANUP
PlotCandles now include independent transparency controls for:
• Candle body
• Wick
• Border
🟦 USER EXPERIENCE IMPROVEMENTS
• Cleaner settings panel
• More explicit tooltips
• Better code organization and region comments
• Labels, candles, close trackers, and plotted guide lines now follow the same visual state model
• Support/resistance transition colors are preserved instead of being prematurely overridden by extreme colors
This update keeps the spirit of the original EMA Stack Support & Resistance script while making the engine more adaptive, more visually consistent, and better aligned with the broader EMA trend-state framework.
Open-source Skript
Ganz im Sinne von TradingView hat dieser Autor sein/ihr Script als Open-Source veröffentlicht. Auf diese Weise können nun auch andere Trader das Script rezensieren und die Funktionalität überprüfen. Vielen Dank an den Autor! Sie können das Script kostenlos verwenden, aber eine Wiederveröffentlichung des Codes unterliegt unseren Hausregeln.

🆓 Free scripts:
⚡ Pro scripts: tradingview.com/script/hESCvPuH-Predictive-Volume-MTF-Pro/
🙋♂️ Get help with Pinescript: simplecrypto.life/get-help-with-pinescript
⚡ Pro scripts: tradingview.com/script/hESCvPuH-Predictive-Volume-MTF-Pro/
🙋♂️ Get help with Pinescript: simplecrypto.life/get-help-with-pinescript
Haftungsausschluss
Die Informationen und Veröffentlichungen sind nicht als Finanz-, Anlage-, Handels- oder andere Arten von Ratschlägen oder Empfehlungen gedacht, die von TradingView bereitgestellt oder gebilligt werden, und stellen diese nicht dar. Lesen Sie mehr in den Nutzungsbedingungen.
Open-source Skript
Ganz im Sinne von TradingView hat dieser Autor sein/ihr Script als Open-Source veröffentlicht. Auf diese Weise können nun auch andere Trader das Script rezensieren und die Funktionalität überprüfen. Vielen Dank an den Autor! Sie können das Script kostenlos verwenden, aber eine Wiederveröffentlichung des Codes unterliegt unseren Hausregeln.
🆓 Free scripts:
⚡ Pro scripts: tradingview.com/script/hESCvPuH-Predictive-Volume-MTF-Pro/
🙋♂️ Get help with Pinescript: simplecrypto.life/get-help-with-pinescript
⚡ Pro scripts: tradingview.com/script/hESCvPuH-Predictive-Volume-MTF-Pro/
🙋♂️ Get help with Pinescript: simplecrypto.life/get-help-with-pinescript
Haftungsausschluss
Die Informationen und Veröffentlichungen sind nicht als Finanz-, Anlage-, Handels- oder andere Arten von Ratschlägen oder Empfehlungen gedacht, die von TradingView bereitgestellt oder gebilligt werden, und stellen diese nicht dar. Lesen Sie mehr in den Nutzungsbedingungen.