OPEN-SOURCE SCRIPT
RSI Area Bias - Multi-Timeframe Dashboard
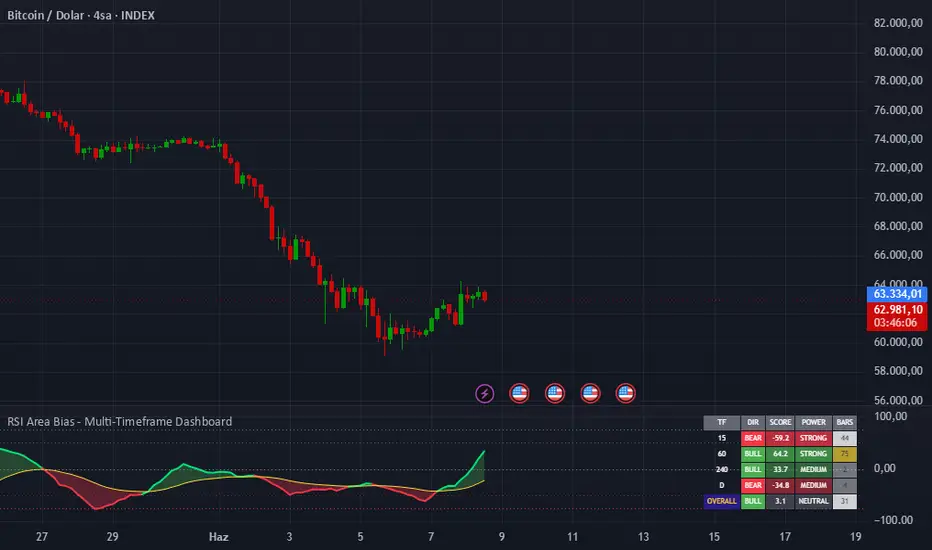
RSI Area Bias - Multi-Timeframe Dashboard is a momentum dominance indicator that quantifies the balance of bullish and bearish pressure across four independent timeframes simultaneously. Rather than plotting a raw RSI line, it measures the cumulative area between the RSI and its moving average over a rolling window, converts that area into a normalized score between −100 and +100, and presents the results in a color-coded dashboard table — giving traders an objective, cross-timeframe view of market bias at a glance.
What Problem This Solves
Standard RSI indicators are single-timeframe tools. A trader looking at a 15-minute chart has no immediate way to know whether the 1H, 4H, or Daily RSI structure is bullish or bearish without switching timeframes manually. This indicator solves that by computing a normalized momentum score for each of four user-defined timeframes and displaying them all in one persistent table — regardless of which timeframe the chart is currently set to.
How It Works — Technical Details
Area Score Calculation:
For each timeframe, the script computes ta.rsi(close, rsiLen) and smooths it with ta.ema(rsiVal, maLen) to produce a dynamic baseline. The gap between the RSI and its EMA is split into a bullish component (RSI above EMA) and a bearish component (RSI below EMA). Each component is accumulated using ta.sma() * lookback over the user-defined lookback window, producing a raw area value that reflects cumulative momentum pressure — not just the current RSI reading.
Normalization to −100 / +100:
Raw area scores vary enormously across different assets and timeframes (a crypto score might be 800 while a forex score is 3). To make STRONG/WEAK classifications meaningful across any symbol, the raw score is normalized using a rolling min/max window (ta.highest and ta.lowest over normLen bars). The result is always between −100 and +100, where +100 means maximum historical bullish dominance and −100 means maximum historical bearish dominance.
Timeframe Independence:
All calculations — RSI, EMA, area accumulation, normalization, and trend duration counting — are executed inside a single master function f_all() and called via request.security() for each timeframe. This means every timeframe's score is computed using its own bars, not the chart's bars. The table values remain identical regardless of which timeframe the chart is set to.
Trend Duration:
Inside f_all(), the script iterates backward through up to 499 bars of that timeframe's history to count how many consecutive bars the current direction (bull/bear) has been maintained. This bar count is returned alongside the score and displayed in the BARS column of the table.
Overall Bias Row:
A weighted average of all four timeframe scores is computed as (score1×1 + score2×2 + score3×3 + score4×4) / 10, giving progressively more weight to higher timeframes. This single value represents the aggregate directional bias across the entire timeframe stack.
Dashboard Table
The top-right table displays five columns for each timeframe plus an OVERALL row:
TF — the timeframe label
DIR — BULL or BEAR, colored green or red
SCORE — normalized value from −100 to +100, color intensity reflects magnitude
POWER — VERY STRONG / STRONG / MEDIUM / WEAK / NEUTRAL, color-matched to direction and intensity (dark green = strong bull, faded green = weak bull, dark red = strong bear, faded red = weak bear)
BARS — number of consecutive bars the current direction has held; longer streaks shown in yellow
Chart Panel
The current chart timeframe's normalized score is plotted as a line, alongside its EMA (Score MA). The area between the two lines is filled green when the score is above the MA (momentum accelerating) and red when below (momentum fading). Five horizontal reference lines mark the key thresholds at 0, ±50, and ±75.
How To Use
Set the four timeframes from short to long (e.g. 15m, 1H, 4H, Daily) to build a complete timeframe stack
When all four DIR cells show BULL and OVERALL is BULL STRONG or higher, conditions favor long momentum trades
When higher timeframes (4H, Daily) are BEAR but lower timeframes are BULL, expect pullbacks rather than trend reversals
Use the BARS column to assess trend maturity — a very high bar count may indicate an overextended move
The chart panel fill turning green (score crossing above its MA) can serve as an early signal of momentum shift before the score crosses zero
Adjust Touch Sensitivity per asset class:
Crypto: normLen 150–300
Forex: normLen 100–200
Equities: normLen 100–250
Inputs Summary
InputDefaultDescriptionRSI Length14RSI calculation periodMA Length14EMA applied to RSI for gap measurementArea Lookback100Window for accumulating bull/bear areaScore MA Length21EMA of the normalized score for the chart panelNormalization Lookback200Rolling window for min/max normalizationTF 1–415m/1H/4H/DFour independent timeframes for the dashboard
Originality
This script is an original work combining RSI-EMA area integration, rolling normalization, and timeframe-independent multi-security computation into a unified momentum dashboard. While RSI divergence and multi-timeframe analysis are well-established concepts, the specific implementation — measuring the signed cumulative area between RSI and its EMA, normalizing it dynamically using a rolling historical range, computing trend duration in native timeframe bars via request.security(), and weighting a four-timeframe bias into a single overall score — represents the author's own methodology for transforming RSI from a single oscillator into a quantified, cross-timeframe momentum scoring system.
Disclaimer
This indicator is intended for educational and analytical purposes only. No indicator can predict future price movements with certainty. Always combine multiple forms of analysis and apply proper risk management before making any trading decisions.
Short Description :
Measures the cumulative area between RSI and its EMA across four independent timeframes, normalizes each score to −100/+100, and displays direction, strength, and trend duration in a persistent dashboard table. All timeframe calculations run natively in their own bars, ensuring consistent readings regardless of the chart timeframe.
What Problem This Solves
Standard RSI indicators are single-timeframe tools. A trader looking at a 15-minute chart has no immediate way to know whether the 1H, 4H, or Daily RSI structure is bullish or bearish without switching timeframes manually. This indicator solves that by computing a normalized momentum score for each of four user-defined timeframes and displaying them all in one persistent table — regardless of which timeframe the chart is currently set to.
How It Works — Technical Details
Area Score Calculation:
For each timeframe, the script computes ta.rsi(close, rsiLen) and smooths it with ta.ema(rsiVal, maLen) to produce a dynamic baseline. The gap between the RSI and its EMA is split into a bullish component (RSI above EMA) and a bearish component (RSI below EMA). Each component is accumulated using ta.sma() * lookback over the user-defined lookback window, producing a raw area value that reflects cumulative momentum pressure — not just the current RSI reading.
Normalization to −100 / +100:
Raw area scores vary enormously across different assets and timeframes (a crypto score might be 800 while a forex score is 3). To make STRONG/WEAK classifications meaningful across any symbol, the raw score is normalized using a rolling min/max window (ta.highest and ta.lowest over normLen bars). The result is always between −100 and +100, where +100 means maximum historical bullish dominance and −100 means maximum historical bearish dominance.
Timeframe Independence:
All calculations — RSI, EMA, area accumulation, normalization, and trend duration counting — are executed inside a single master function f_all() and called via request.security() for each timeframe. This means every timeframe's score is computed using its own bars, not the chart's bars. The table values remain identical regardless of which timeframe the chart is set to.
Trend Duration:
Inside f_all(), the script iterates backward through up to 499 bars of that timeframe's history to count how many consecutive bars the current direction (bull/bear) has been maintained. This bar count is returned alongside the score and displayed in the BARS column of the table.
Overall Bias Row:
A weighted average of all four timeframe scores is computed as (score1×1 + score2×2 + score3×3 + score4×4) / 10, giving progressively more weight to higher timeframes. This single value represents the aggregate directional bias across the entire timeframe stack.
Dashboard Table
The top-right table displays five columns for each timeframe plus an OVERALL row:
TF — the timeframe label
DIR — BULL or BEAR, colored green or red
SCORE — normalized value from −100 to +100, color intensity reflects magnitude
POWER — VERY STRONG / STRONG / MEDIUM / WEAK / NEUTRAL, color-matched to direction and intensity (dark green = strong bull, faded green = weak bull, dark red = strong bear, faded red = weak bear)
BARS — number of consecutive bars the current direction has held; longer streaks shown in yellow
Chart Panel
The current chart timeframe's normalized score is plotted as a line, alongside its EMA (Score MA). The area between the two lines is filled green when the score is above the MA (momentum accelerating) and red when below (momentum fading). Five horizontal reference lines mark the key thresholds at 0, ±50, and ±75.
How To Use
Set the four timeframes from short to long (e.g. 15m, 1H, 4H, Daily) to build a complete timeframe stack
When all four DIR cells show BULL and OVERALL is BULL STRONG or higher, conditions favor long momentum trades
When higher timeframes (4H, Daily) are BEAR but lower timeframes are BULL, expect pullbacks rather than trend reversals
Use the BARS column to assess trend maturity — a very high bar count may indicate an overextended move
The chart panel fill turning green (score crossing above its MA) can serve as an early signal of momentum shift before the score crosses zero
Adjust Touch Sensitivity per asset class:
Crypto: normLen 150–300
Forex: normLen 100–200
Equities: normLen 100–250
Inputs Summary
InputDefaultDescriptionRSI Length14RSI calculation periodMA Length14EMA applied to RSI for gap measurementArea Lookback100Window for accumulating bull/bear areaScore MA Length21EMA of the normalized score for the chart panelNormalization Lookback200Rolling window for min/max normalizationTF 1–415m/1H/4H/DFour independent timeframes for the dashboard
Originality
This script is an original work combining RSI-EMA area integration, rolling normalization, and timeframe-independent multi-security computation into a unified momentum dashboard. While RSI divergence and multi-timeframe analysis are well-established concepts, the specific implementation — measuring the signed cumulative area between RSI and its EMA, normalizing it dynamically using a rolling historical range, computing trend duration in native timeframe bars via request.security(), and weighting a four-timeframe bias into a single overall score — represents the author's own methodology for transforming RSI from a single oscillator into a quantified, cross-timeframe momentum scoring system.
Disclaimer
This indicator is intended for educational and analytical purposes only. No indicator can predict future price movements with certainty. Always combine multiple forms of analysis and apply proper risk management before making any trading decisions.
Short Description :
Measures the cumulative area between RSI and its EMA across four independent timeframes, normalizes each score to −100/+100, and displays direction, strength, and trend duration in a persistent dashboard table. All timeframe calculations run natively in their own bars, ensuring consistent readings regardless of the chart timeframe.
Open-source Skript
Ganz im Sinne von TradingView hat dieser Autor sein/ihr Script als Open-Source veröffentlicht. Auf diese Weise können nun auch andere Trader das Script rezensieren und die Funktionalität überprüfen. Vielen Dank an den Autor! Sie können das Script kostenlos verwenden, aber eine Wiederveröffentlichung des Codes unterliegt unseren Hausregeln.

Haftungsausschluss
Die Informationen und Veröffentlichungen sind nicht als Finanz-, Anlage-, Handels- oder andere Arten von Ratschlägen oder Empfehlungen gedacht, die von TradingView bereitgestellt oder gebilligt werden, und stellen diese nicht dar. Lesen Sie mehr in den Nutzungsbedingungen.
Open-source Skript
Ganz im Sinne von TradingView hat dieser Autor sein/ihr Script als Open-Source veröffentlicht. Auf diese Weise können nun auch andere Trader das Script rezensieren und die Funktionalität überprüfen. Vielen Dank an den Autor! Sie können das Script kostenlos verwenden, aber eine Wiederveröffentlichung des Codes unterliegt unseren Hausregeln.
Haftungsausschluss
Die Informationen und Veröffentlichungen sind nicht als Finanz-, Anlage-, Handels- oder andere Arten von Ratschlägen oder Empfehlungen gedacht, die von TradingView bereitgestellt oder gebilligt werden, und stellen diese nicht dar. Lesen Sie mehr in den Nutzungsbedingungen.