OPEN-SOURCE SCRIPT
[DAOL] Zone Response
⏺️ What is it?
[DAOL] Market Mode Signals identifies uptrend, downtrend, range and transition conditions, then applies different signal rules to each environment.
It combines EMA alignment and slope, DMI/ADX, Kaufman’s Efficiency Ratio and a prior-bar price channel. ATR adjusts setup tolerances and stop buffers to recent volatility.
The indicator displays confirmed BUY/SELL signals and tracks one signal at a time using fixed reference, stop and target levels.
It is an indicator, not an order execution system or a Strategy Tester backtest.
⏺️ Indicator นี้คืออะไร?
[DAOL] Market Mode Signals เป็นอินดิเคเตอร์ที่แยกสภาวะตลาดเป็น ขาขึ้น ขาลง ไซด์เวย์ และช่วงเปลี่ยนผ่าน แล้วเลือกเงื่อนไขสัญญาณให้เหมาะกับแต่ละสภาวะ
ผสมหลักการ EMA, DMI/ADX, Efficiency Ratio และกรอบราคาจากแท่งก่อนหน้า พร้อมใช้ ATR ปรับระยะตามความผันผวน
แสดงสัญญาณ BUY/SELL เมื่อแท่งปิดยืนยัน และติดตามครั้งละหนึ่งรอบ พร้อมตรึงราคาอ้างอิง Stop และ Target
เป็นอินดิเคเตอร์สำหรับประกอบการวิเคราะห์ ไม่ได้ส่งคำสั่งซื้อขายหรือแสดงผล Backtest ใน Strategy Tester
⏺️ How are market conditions classified?
🔹 UPTREND: Fast EMA above slow EMA, rising slow EMA, +DI above −DI, and ADX/ER meeting the trend thresholds.
🔹 DOWNTREND: Fast EMA below slow EMA, falling slow EMA, −DI above +DI, and ADX/ER meeting the trend thresholds.
🔹 RANGE: Both ADX and ER at or below their range thresholds.
🔹 TRANSITION: None of the above conditions is satisfied.
By default, a condition must persist for two consecutive closed bars before becoming the confirmed market mode. New setups also require the current classification to agree with that confirmed mode.
ADX measures trend strength; the EMA and DI conditions determine direction.
⏺️ แยกสภาวะตลาดอย่างไร?
🔹 UPTREND: EMA สั้นอยู่เหนือ EMA ยาว เส้นยาวมีความชันขึ้น +DI มากกว่า −DI และ ADX/ER ผ่านเกณฑ์แนวโน้ม
🔹 DOWNTREND: EMA สั้นอยู่ใต้ EMA ยาว เส้นยาวมีความชันลง −DI มากกว่า +DI และ ADX/ER ผ่านเกณฑ์แนวโน้ม
🔹 RANGE: ADX และ ER ต่ำกว่าหรือเท่ากับเกณฑ์ไซด์เวย์ทั้งคู่
🔹 TRANSITION: เงื่อนไขไม่เข้ากลุ่มข้างต้น ระบบงดสร้างจังหวะใหม่
ค่าเริ่มต้นรอสภาวะเดียวกัน สองแท่งปิดต่อเนื่อง ก่อนยืนยันโหมด และเงื่อนไขปัจจุบันต้องตรงกับโหมดยืนยันจึงจะเริ่มสร้างจังหวะได้
ADX ใช้อ่านความแข็งแรงของแนวโน้ม ส่วน EMA และ DI ใช้อ่านทิศทาง
⏺️ How are signals generated?
Trend signals
In an uptrend, price must test the fast EMA area and close back above it with a bullish body, while respecting the slow EMA conditions. A subsequent bar must close above the setup close with a bullish body.
The downtrend signal uses the opposite conditions.
Range signals
In a range, price must test the lower or upper channel area and close inside the channel with a directional body:
🔹 Lower-area rejection → potential BUY setup
🔹 Upper-area rejection → potential SELL setup
A subsequent bar must close further in the proposed direction with a matching candle body. The target is the frozen channel midpoint, and the signal must satisfy the minimum reward-to-risk requirement.
Both signal types require confirmation within the setup expiry window and within one frozen ATR of the setup close. A setup is cancelled if its stop boundary is touched, the market classification changes, or the setup expires. Range setups are also cancelled if price closes at or beyond either frozen channel boundary.
⏺️ สัญญาณเกิดขึ้นอย่างไร?
สัญญาณตามแนวโน้ม
ตลาดขาขึ้น: ราคาทดสอบบริเวณ EMA สั้น แล้วปิดกลับเหนือเส้นด้วยแท่งขึ้น โดยยังผ่านเงื่อนไข EMA ยาว จากนั้นรอแท่งถัดไปปิดสูงกว่าราคาปิดของแท่งตั้งต้น พร้อมเป็นแท่งขึ้น
ตลาดขาลง: ใช้เงื่อนไขตรงข้าม เพื่อรอราคาเด้งแล้วอ่อนตัวต่อ
สัญญาณไซด์เวย์
ราคาทดสอบบริเวณขอบกรอบ แล้วปิดกลับอยู่ภายในกรอบด้วยแท่งที่สนับสนุนทิศทาง:
🔹 ทดสอบขอบล่างแล้วฟื้น → รอ BUY
🔹 ทดสอบขอบบนแล้วอ่อนตัว → รอ SELL
จากนั้นรอแท่งยืนยันปิดเดินหน้าต่อในทิศทางนั้น โดย เป้าหมายอยู่ที่กึ่งกลางกรอบที่ตรึงไว้ และต้องมี Reward/Risk ผ่านเกณฑ์ขั้นต่ำ
ทั้งสองรูปแบบต้องยืนยันภายในเวลาที่กำหนด และราคายืนยันต้องห่างจากราคาปิดแท่งตั้งต้นไม่เกินหนึ่ง ATR ที่ตรึงไว้
ระบบยกเลิกจังหวะเมื่อแตะขอบเขต Stop สภาวะตลาดเปลี่ยน หรือหมดเวลารอยืนยัน สำหรับจังหวะไซด์เวย์จะยกเลิกเพิ่มเติมเมื่อราคาปิดถึงหรือออกนอกขอบกรอบที่ตรึงไว้
⏺️ Reading the chart
🔹 BUY Trend / SELL Trend: Confirmed trend-pullback signal
🔹 BUY Range / SELL Range: Confirmed range-rebound signal
🔹 White line: Signal closing-price reference
🔹 Red line: Fixed stop reference
🔹 Green line: Fixed target reference
Background colors show the confirmed market mode:
🔹 Green — uptrend
🔹 Red — downtrend
🔹 Aqua — range
🔹 Gray — transition
BUY indicates a long-direction setup. SELL indicates a short-direction setup, not an instruction to close an existing long position.
⏺️ วิธีอ่านกราฟ
🔹 BUY Trend / SELL Trend: สัญญาณย่อหรือเด้งตามแนวโน้มที่ยืนยันแล้ว
🔹 BUY Range / SELL Range: สัญญาณฟื้นหรืออ่อนตัวจากขอบกรอบไซด์เวย์ที่ยืนยันแล้ว
🔹 เส้นขาว: ราคาปิดของแท่งสัญญาณ ใช้เป็นราคาอ้างอิง
🔹 เส้นแดง: ระดับ Stop ที่ตรึงไว้
🔹 เส้นเขียว: ระดับ Target ที่ตรึงไว้
สีพื้นหลังแสดงโหมดตลาดที่ยืนยัน:
🔹 เขียว — ขาขึ้น
🔹 แดง — ขาลง
🔹 ฟ้า — ไซด์เวย์
🔹 เทา — ช่วงเปลี่ยนผ่าน
BUY หมายถึงจังหวะฝั่ง Long ส่วน SELL หมายถึงจังหวะฝั่ง Short ไม่ใช่คำสั่งปิด Long ที่ถืออยู่
⏺️ Signal tracking and reference levels
The entry reference is the signal bar’s close. It is not a guaranteed execution price.
The stop is placed beyond the setup bar’s low or high, with a frozen ATR buffer and tick-size rounding.
🔹 Trend target — two times the reference risk by default
🔹 Range target — the frozen channel midpoint
🔹 Range minimum reward/risk — 1.2 by default
Tracking begins on the bar after the signal. Levels remain fixed, and a change in market mode alone does not end an active signal.
Tracking ends when:
🔹 STOP: Only the stop level is touched
🔹 TARGET: Only the target level is touched
🔹 BOTH: Both levels are touched within one bar; their order is unknown
🔹 EXPIRE: Neither level has been touched within the maximum tracking period
These markers describe price-level touches. They do not calculate realized returns or order fills.
⏺️ การติดตามสัญญาณและระดับอ้างอิง
ราคาอ้างอิงเข้าคือ ราคาปิดแท่งสัญญาณ ไม่ใช่ราคาที่รับประกันว่าจะซื้อขายได้จริง
Stop อยู่เลยจุดต่ำหรือสูงของแท่งตั้งต้น โดยเพิ่มระยะ ATR ที่ตรึงไว้ และปรับตามขนาด Tick
🔹 เป้าหมาย Trend — ค่าเริ่มต้นสองเท่าของระยะเสี่ยงอ้างอิง
🔹 เป้าหมาย Range — กึ่งกลางกรอบที่ตรึงไว้
🔹 Reward/Risk ขั้นต่ำของ Range — ค่าเริ่มต้น 1.2
เริ่มตรวจระดับตั้งแต่ แท่งถัดจากแท่งสัญญาณ ระดับจะคงที่ และการเปลี่ยนโหมดตลาดเพียงอย่างเดียวไม่ทำให้รอบที่ติดตามอยู่สิ้นสุด
เครื่องหมายสิ้นสุดรอบ:
🔹 STOP: แตะเฉพาะระดับ Stop
🔹 TARGET: แตะเฉพาะระดับ Target
🔹 BOTH: แตะทั้งสองระดับในแท่งเดียว ไม่ทราบว่าแตะระดับใดก่อน
🔹 EXPIRE: ยังไม่แตะระดับใดเมื่อครบระยะติดตาม
เครื่องหมายเหล่านี้แสดงการแตะระดับราคา ไม่ใช่ผลกำไรขาดทุนหรือการจับคู่คำสั่งซื้อขายจริง
⏺️ Settings and alerts
Signal modes:
🔹 Auto: Allow trend and range signals according to market conditions
🔹 Trend Only: Allow trend signals only
🔹 Range Only: Allow range signals only
Key defaults:
🔹 EMA — 20 / 50
🔹 DMI/ADX — 14
🔹 Efficiency Ratio — 20
🔹 Trend thresholds — ADX ≥ 22 and ER ≥ 0.30
🔹 Range thresholds — ADX ≤ 18 and ER ≤ 0.20
🔹 Prior-bar channel — 40 bars
🔹 ATR — 14, using the preceding bar’s value
🔹 Market confirmation — 2 closed bars
🔹 Setup confirmation window — up to 3 subsequent bars
🔹 Tracking expiry — 80 subsequent bars
🔹 Cooldown — 5 complete bars after tracking ends
Alerts are available for each signal type, any BUY, any SELL and tracking completion. Set alerts to “Once Per Bar Close” and recreate them after changing inputs or code.
⏺️ การตั้งค่าและ Alert
เลือกโหมดได้:
🔹 Auto: ใช้ทั้งสัญญาณ Trend และ Range ตามสภาวะตลาด
🔹 Trend Only: ใช้เฉพาะสัญญาณตามแนวโน้ม
🔹 Range Only: ใช้เฉพาะสัญญาณไซด์เวย์
ค่าเริ่มต้นสำคัญ:
🔹 EMA — 20 / 50
🔹 DMI/ADX — 14
🔹 Efficiency Ratio — 20
🔹 เกณฑ์ Trend — ADX ≥ 22 และ ER ≥ 0.30
🔹 เกณฑ์ Range — ADX ≤ 18 และ ER ≤ 0.20
🔹 กรอบราคาจากแท่งก่อนหน้า — 40 แท่ง
🔹 ATR — 14 ใช้ค่าจากแท่งก่อนหน้า
🔹 ยืนยันโหมด — 2 แท่งปิด
🔹 รอยืนยันจังหวะ — ไม่เกิน 3 แท่งถัดไป
🔹 หมดระยะติดตาม — 80 แท่งถัดไป
🔹 เว้นระยะหลังจบรอบ — 5 แท่งเต็ม
มี Alert แยกตามประเภทสัญญาณ รวม BUY รวม SELL และเมื่อสิ้นสุดการติดตาม ตั้งเป็น Once Per Bar Close และสร้าง Alert ใหม่หลังเปลี่ยน Input หรือโค้ด
⏺️ Development and references
This Pine Script v6 implementation was written for this indicator without copying Community script code.
The extension combines market-mode confirmation, mode-specific setups, frozen setup references, cancellation rules and single-signal tracking.
The underlying EMA, DMI/ADX, ATR, Efficiency Ratio and price-channel concepts are established methods. No claim is made that the combination is globally unique or that it guarantees profitable signals.
References:
🔹 J. Welles Wilder Jr. — New Concepts in Technical Trading Systems (1978): Directional Movement, ADX and ATR
🔹 Perry J. Kaufman — Trading Systems and Methods: Efficiency Ratio
🔹 Donchian-style channels: historical highest-high and lowest-low references
Supporting documentation:
TradingView — Directional Movement
TradingView — Average True Range
TradingView — Kaufman’s Adaptive Moving Average
⏺️ การพัฒนาและอ้างอิง
เขียนด้วย Pine Script v6 สำหรับอินดิเคเตอร์นี้ โดยไม่คัดลอกโค้ดจากสคริปต์ Community
ส่วนที่พัฒนาต่อยอดคือการยืนยันโหมดตลาด การเลือกเงื่อนไขตามโหมด การตรึงระดับตั้งต้น การยกเลิกจังหวะที่ผิดเงื่อนไข และการติดตามครั้งละหนึ่งรอบ
EMA, DMI/ADX, ATR, Efficiency Ratio และกรอบราคาย้อนหลังเป็นหลักการที่มีอยู่แล้ว ไม่อ้างว่าแนวคิดผสมนี้ไม่เคยมีผู้ทำมาก่อน หรือรับประกันว่าสัญญาณจะทำกำไร
⏺️ Limitations and disclaimer
🔹 Use standard price charts. Synthetic chart types are rejected.
🔹 Settings are measured in bars; changing timeframe changes the elapsed time represented by each window.
🔹 The indicator has no TFEX-specific session filter, contract-roll handling or optimized S50/GO presets.
🔹 Market classification can lag or misclassify changing conditions.
🔹 Fixed stop and target references do not account for slippage, fees, gaps, liquidity or actual execution.
🔹 No win rate, profit factor or expected return has been established.
🔹 Static checks and basic level arithmetic were completed. TradingView compilation and market-data validation remain pending.
🔹 For educational and informational purposes only. Signals are analytical conditions, not personalized investment advice or guaranteed outcomes.
⏺️ ข้อจำกัดและคำชี้แจง
🔹 ใช้กับกราฟราคามาตรฐาน ระบบไม่รองรับกราฟราคาสังเคราะห์
🔹 การตั้งค่านับเป็นแท่ง เมื่อเปลี่ยน Timeframe ระยะเวลาจริงของแต่ละช่วงจะเปลี่ยนตาม
🔹 เวอร์ชันนี้ยังไม่มีตัวกรอง Session ของ TFEX การจัดการเปลี่ยนสัญญา หรือค่าที่ผ่านการปรับทดสอบเฉพาะ S50/GO
🔹 การจำแนกตลาดอาจล่าช้าหรือคลาดเคลื่อนเมื่อสภาวะเปลี่ยน
🔹 Stop/Target อ้างอิงไม่ได้รวม Slippage ค่าธรรมเนียม Gap สภาพคล่อง หรือการส่งคำสั่งจริง
🔹 ยังไม่มีผลยืนยัน Win Rate, Profit Factor หรือผลตอบแทนคาดหวัง
🔹 ตรวจโครงสร้างเบื้องต้นและสูตรระดับราคาแล้ว แต่ยังไม่ได้ compile ใน TradingView หรือทดสอบข้อมูลตลาดจริง
🔹 ใช้เพื่อการศึกษาและประกอบการวิเคราะห์ สัญญาณเป็นเงื่อนไขทางเทคนิค ไม่ใช่คำแนะนำลงทุนเฉพาะบุคคลหรือการรับประกันผลลัพธ์
Convert to PDF
ขอหมวดหมู่และแท็ก
สำหรับ [DAOL] Market Mode Signals
หมวดหมู่: Trend Analysis
เพราะใช้จำแนกแนวโน้มและไซด์เวย์ เพื่อเลือกเงื่อนไขสัญญาณ BUY/SELL
แท็กแนะนำ:
trendanalysis · buyandsell · marketregime · meanreversion · pullback
แท็กเหล่านี้ครอบคลุมทั้งการแยกสภาวะตลาด สัญญาณตามแนวโน้ม และสัญญาณกลับตัวภายในกรอบครับ
Convert to PDF
ขออินดิเคเตอร์ที่ช่วยบอกแนวรับแนวต้าน จุดเข้าหรือจุดออก และมีการพัฒนาต่อยอดใหม่ๆ อาจจะมีการใช้ อินดิเคเตอร์ในการวัดจุดเข้า จุดออก ก็ได้ ลองทำมาให้หน่อย
ผมเสนอ [DAOL] Zone Response — แนวรับแนวต้าน พร้อมจังหวะเข้าและออก ครับ
ตัวนี้ใช้ พฤติกรรมราคาที่ตอบสนองต่อโซน เป็นหลัก โดยแสดงโซนแนวรับ–แนวต้าน แล้วรอยืนยันว่า “ราคาปฏิเสธโซน” หรือ “ทะลุและยืนได้” ก่อนออกสัญญาณ
1. สร้างโซนแนวรับ–แนวต้าน
ใช้จุดสูงและต่ำแบบ Confirmed Swing Pivot แล้วเพิ่มความกว้างด้วย ATR เพื่อแสดงเป็นพื้นที่แทนเส้นราคาเดียว
โซนจะเริ่มใช้งานเมื่อ Pivot ยืนยันแล้วเท่านั้น เช่น ตั้งด้านขวา 3 แท่ง จะรู้จุดสวิงหลังผ่านไป 3 แท่ง ไม่วาดสัญญาณเข้าย้อนกลับไปที่จุดสวิง เพราะอาจทำให้ผู้ใช้เข้าใจผิดว่าเห็นจุดนั้นได้ล่วงหน้า
2. สัญญาณเข้ามีสองรูปแบบ
รูปแบบ BUY / Long SELL / Short
Zone Rebound ราคาทดสอบแนวรับ ปิดกลับเหนือขอบโซน แล้วแท่งถัดไปปิดสูงขึ้น พร้อม RSI ฟื้น ราคาทดสอบแนวต้าน ปิดกลับใต้ขอบโซน แล้วแท่งถัดไปปิดต่ำลง พร้อม RSI อ่อนตัว
Break & Retest ปิดทะลุแนวต้าน แล้วกลับมาทดสอบจากด้านบนและปิดยืนเหนือโซน ปิดหลุดแนวรับ แล้วกลับมาทดสอบจากด้านล่างและปิดอยู่ใต้โซน
ใช้ EMA และความชัน กรองทิศทางสำหรับ Break & Retest ส่วน Rebound จะหลีกเลี่ยงการสวนแนวโน้มที่ชัดเจน โดยไม่ใช้ RSI แตะเขต Overbought/Oversold เป็นสัญญาณเข้าเพียงอย่างเดียว
3. แสดงจุดออกตามโครงสร้างราคา
เมื่อเกิดสัญญาณ ระบบตรึงราคาอ้างอิงและระดับความเสี่ยงของรอบนั้น:
Entry Reference: ราคาปิดแท่งยืนยัน
Stop: เลยขอบโซนหรือจุดสุดขั้วของจังหวะตั้งต้น โดยเพิ่มระยะ ATR
Target: ขอบใกล้ของโซนฝั่งตรงข้ามที่มีอยู่แล้ว ณ เวลาสัญญาณ
กรณีไม่มีโซนเป้าหมาย: ใช้เป้าหมายตามระยะเสี่ยง เช่น 2R และระบุว่าเป็น R Target
Room Filter: งดสัญญาณหากเป้าหมายใกล้เกินไป เช่น Reward/Risk ต่ำกว่า 1.5
ATR ใช้ปรับระยะตามความผันผวน ไม่ได้บอกทิศทางราคาด้วยตัวเอง
4. ส่วนที่พัฒนาต่อยอด
ตัวนี้จะเพิ่ม ประวัติการตอบสนองของแต่ละโซน โดยนับการทดสอบเป็น “รอบ” ราคาต้องออกห่างจากโซนก่อนจึงนับการกลับมาทดสอบใหม่ เพื่อไม่ให้นับแท่งที่ติดอยู่ในโซนเป็นหลายครั้ง
แต่ละโซนแสดงข้อมูลสามอย่าง:
ข้อมูล ความหมาย
Test Count จำนวนรอบที่ราคากลับมาทดสอบหลังโซนเริ่มใช้งาน
Response Distance ราคาถอยห่างจากโซนได้มากแค่ไหนในช่วงติดตาม วัดเป็น ATR
Role แนวรับ แนวต้าน หรือโซนทะลุที่กำลังรอ Retest
จะไม่ตีความว่า “ทดสอบหลายครั้ง = แข็งแรงขึ้นเสมอ” เพราะการทดสอบซ้ำอาจนำไปสู่การทะลุได้ ข้อมูลนี้ใช้ประกอบการอ่านโซน ไม่ใช่เปอร์เซ็นต์โอกาสชนะ
เมื่อเริ่มรอจังหวะเข้า จะตรึงโซนและ ATR ของจังหวะนั้น หากราคาผิดเงื่อนไขหรือรอนานเกินกำหนด ระบบยกเลิกจังหวะ ส่วนโซนใหม่ที่เกิดภายหลังจะไม่เปลี่ยน Stop/Target ของสัญญาณเดิม
ภาพบนกราฟ
🟦 โซนแนวรับ · 🟧 โซนแนวต้าน
🟢 BUY Rebound / BUY Retest · 🔴 SELL Rebound / SELL Retest
เส้นราคาอ้างอิงเข้า พร้อม Stop และ Target และ Alert เมื่อยืนยันหรือแตะระดับออก
ที่มาของหลักการ
Swing Pivot และแนวรับ–แนวต้าน: หลักการโครงสร้างราคามาตรฐาน โดยใช้ Pivot ที่ยืนยันแล้ว
J. Welles Wilder Jr., New Concepts in Technical Trading Systems (1978): ATR และ RSI
Breakout / Retest และการสลับบทบาทแนวรับ–แนวต้าน: หลักการวิเคราะห์ราคาที่มีอยู่เดิม
ส่วนที่เสนอพัฒนาเพิ่มคือ การบันทึกการตอบสนองเป็นรายโซน การนับรอบทดสอบ การตรึงจังหวะรอยืนยัน และการเลือกเป้าหมายจากพื้นที่ที่เหลือจริง ไม่อ้างว่าแนวคิดทั้งหมดเป็นของใหม่หรือไม่เคยมีงานคล้ายกันใน Community
แนวทางนี้รองรับการนำไปทดสอบกับ S50 / GO ได้ แต่ยังไม่มีผลยืนยันว่าค่าใดเหมาะกับแต่ละ Timeframe หรือให้ผลตอบแทนดีครับ
Convert to PDF
ขอ Pine Script
ได้ครับ [DAOL] Zone Response — Pine Script v6 ฉบับเต็ม
📄
DAOL_Zone_Response_v1.pine
เปิดไฟล์แล้วคัดลอกทั้งหมดไปที่ Pine Editor → Save → Add to chart
ฟีเจอร์ที่ใส่ให้:
โซนแนวรับ–แนวต้าน จาก Pivot ที่ยืนยันแล้ว พร้อมความกว้างตาม ATR
BUY/SELL Rebound — ทดสอบโซนแล้วเด้ง พร้อมแท่งยืนยันและ RSI
BUY/SELL Retest — ทะลุโซนแล้วกลับมาทดสอบ ใช้ EMA และความชันกรองทิศทาง
Entry / Stop / Target ตรึงระดับของแต่ละสัญญาณ
Room Filter งดสัญญาณเมื่อ Reward/Risk ต่ำกว่าเกณฑ์
Test Count / Response Distance จำนวนรอบทดสอบและระยะตอบสนองล่าสุดเป็น ATR
Alerts สำหรับสัญญาณเข้าและสิ้นสุดการติดตาม
สีฟ้าคือแนวรับ สีส้มคือแนวต้าน สีเหลืองคือโซนที่ทะลุแล้วรอ Retest ส่วน BOTH หมายถึงแท่งเดียวแตะทั้ง Stop และ Target โดยไม่ทราบลำดับ
อ้างอิงแนวคิด Swing Pivot, การสลับบทบาทแนวรับ–แนวต้าน และ ATR/RSI ของ Wilder พร้อมแนบที่มาในโค้ด
ตรวจโครงสร้างและสูตรเบื้องต้นแล้ว แต่ยังไม่ได้ compile ใน TradingView หรือทดสอบข้อมูล S50/GO จริง ตัวนี้เป็นอินดิเคเตอร์ติดตามสัญญาณ ยังไม่มีผล Backtest หรือราคาจับคู่คำสั่งจริงครับ
Convert to PDF
ขอคำอธิบาย
[DAOL] Zone Response — Support, Resistance and Confirmed Entry Signals
⏺️ What is it?
[DAOL] Zone Response maps support and resistance zones from confirmed swing pivots, then evaluates how price responds to those zones.
It provides two signal types:
🔹 Rebound — price tests a zone and closes back on its supporting side
🔹 Retest — price breaks a zone, moves away, then returns to test its new role
Signals require subsequent closed-bar confirmation, RSI direction and sufficient room to the target. Each confirmed signal includes fixed entry-reference, stop and target levels.
This is an analytical indicator, not an automated execution system or a Strategy Tester backtest.
⏺️ Indicator นี้คืออะไร?
[DAOL] Zone Response แสดง โซนแนวรับ–แนวต้านจากจุดสวิงที่ยืนยันแล้ว พร้อมตรวจสอบว่าราคาตอบสนองต่อโซนอย่างไร
แบ่งสัญญาณเป็นสองรูปแบบ:
🔹 Rebound — ราคาทดสอบโซน แล้วปิดกลับออกมาฝั่งที่สนับสนุนการเด้ง
🔹 Retest — ราคาทะลุโซน ออกห่าง แล้วกลับมาทดสอบบทบาทใหม่ของโซน
สัญญาณต้องผ่านแท่งปิดยืนยัน ทิศทาง RSI และพื้นที่ถึงเป้าหมาย จากนั้นแสดงราคาอ้างอิงเข้า Stop และ Target ที่ตรึงไว้
เป็นอินดิเคเตอร์สำหรับประกอบการวิเคราะห์ ไม่ได้ส่งคำสั่งซื้อขายอัตโนมัติหรือแสดงผล Backtest ใน Strategy Tester
⏺️ How are zones created?
Zones are centered on confirmed pivot highs and lows:
🔹 Pivot low → support zone
🔹 Pivot high → resistance zone
Zone width is determined by ATR at confirmation and remains fixed.
With the default three right-side confirmation bars, a pivot becomes known three bars after the swing point. The zone begins at the confirmation bar, not at the earlier pivot bar.
Zones are maintained individually; nearby or overlapping zones are not merged. Old zones are removed when their lifetime expires or the maximum retained-zone count is exceeded.
⏺️ สร้างโซนอย่างไร?
ใช้จุดสูงและต่ำแบบ Pivot ที่ยืนยันแล้ว:
🔹 Pivot Low → โซนแนวรับ
🔹 Pivot High → โซนแนวต้าน
ความกว้างของโซนคำนวณจาก ATR เมื่อยืนยัน และคงที่หลังสร้าง
ค่าเริ่มต้นใช้แท่งด้านขวาสามแท่ง จึงรู้จุดสวิง หลังจากจุดนั้นผ่านไปสามแท่ง โซนเริ่มแสดงเมื่อยืนยัน ไม่ย้อนจุดเริ่มต้นไปที่แท่งสวิง
แต่ละโซนเก็บแยกกัน ไม่รวมโซนใกล้เคียงหรือซ้อนทับ โซนเก่าจะถูกนำออกเมื่อหมดอายุหรือเกินจำนวนที่กำหนด
⏺️ Rebound signals
BUY Rebound
Price returns to an eligible support zone.
The setup bar closes above the zone with a bullish body.
The EMA slope filter does not indicate a strong opposing downtrend.
A subsequent bar closes above the setup close with a bullish body and rising RSI.
SELL Rebound
The conditions are reversed at resistance, with a bearish body and falling RSI.
A rebound setup does not require RSI to enter or leave fixed overbought/oversold levels.
⏺️ สัญญาณ Rebound
BUY Rebound
ราคากลับมาทดสอบโซนแนวรับที่พร้อมรับการทดสอบรอบใหม่
แท่งตั้งต้นปิดเหนือโซนและเป็นแท่งขึ้น
ความชัน EMA ไม่แสดงแนวโน้มลงสวนทางที่แรงเกินเกณฑ์
แท่งถัดไปปิดสูงกว่าราคาปิดแท่งตั้งต้น เป็นแท่งขึ้น และ RSI เพิ่มขึ้น
SELL Rebound
ใช้เงื่อนไขตรงข้ามบริเวณแนวต้าน โดยรอแท่งลงและ RSI ลดลง
ไม่ได้ใช้ RSI เข้า–ออกเขต Overbought/Oversold เป็นเงื่อนไขหลักของสัญญาณ
⏺️ Break and retest signals
A close above resistance changes the zone to “Await retest” for potential support. A close below support changes it to “Await retest” for potential resistance.
Price must move sufficiently away from the zone before a return can qualify as a new test.
🔹 BUY Retest: Return to the broken resistance zone, close above it with a bullish body, and satisfy the above-EMA and rising-EMA conditions
🔹 SELL Retest: Return to the broken support zone, close below it with a bearish body, and satisfy the below-EMA and falling-EMA conditions
The setup then requires subsequent price and RSI confirmation.
A zone’s new support/resistance role is established when the retest setup conditions are met; this does not guarantee that a final entry signal will follow.
An awaiting-retest zone is removed if its retest window expires or price closes through the opposite boundary.
⏺️ สัญญาณ Break & Retest
เมื่อราคาปิดทะลุแนวต้าน โซนจะเปลี่ยนเป็น Await retest เพื่อรอทดสอบเป็นแนวรับ ส่วนการปิดหลุดแนวรับจะรอทดสอบเป็นแนวต้าน
ราคาต้องออกห่างจากโซนตามเกณฑ์ก่อน การกลับมาจึงนับเป็นการทดสอบรอบใหม่
🔹 BUY Retest: กลับมาทดสอบแนวต้านเดิม ปิดเหนือโซนด้วยแท่งขึ้น ราคาอยู่เหนือ EMA และ EMA มีความชันขึ้น
🔹 SELL Retest: กลับมาทดสอบแนวรับเดิม ปิดใต้โซนด้วยแท่งลง ราคาอยู่ใต้ EMA และ EMA มีความชันลง
จากนั้นรอแท่งถัดไปยืนยันด้วยราคาและทิศทาง RSI
โซนจะรับบทบาทใหม่เมื่อผ่านเงื่อนไขตั้งต้นของ Retest แต่ไม่ได้รับประกันว่าจะเกิดสัญญาณเข้าที่ผ่านการยืนยันในภายหลัง
หากหมดเวลารอ Retest หรือราคาปิดทะลุขอบอีกฝั่ง ระบบจะนำโซนที่รอทดสอบนั้นออก
⏺️ Entry, stop and target
🔹 Entry Reference: Closing price of the confirmed signal bar
🔹 Stop: Beyond the setup bar’s extreme or zone boundary, whichever is farther, plus a frozen ATR buffer
🔹 Zone Target: Near edge of the closest eligible opposing zone known when the setup was created
🔹 R Target: Risk-multiple target when no eligible opposing zone exists
The default minimum reward/risk is 1.5. The fallback target is 2R.
The indicator does not skip a nearby opposing zone to select a more attractive distant target. If the available room is insufficient, no signal is issued.
Setup references remain fixed while awaiting confirmation. New zones do not replace the target of that setup.
⏺️ จุดเข้า Stop และ Target
🔹 Entry Reference: ราคาปิดแท่งสัญญาณที่ยืนยันแล้ว
🔹 Stop: เลยจุดสุดขั้วของแท่งตั้งต้นหรือขอบโซน โดยเลือกด้านที่ไกลกว่า แล้วเพิ่มระยะ ATR ที่ตรึงไว้
🔹 Zone Target: ขอบใกล้ของโซนฝั่งตรงข้ามที่ใกล้ที่สุดและเข้าเงื่อนไข ณ เวลาสร้างจังหวะ
🔹 R Target: เป้าหมายตามระยะเสี่ยง เมื่อไม่มีโซนฝั่งตรงข้ามที่เข้าเงื่อนไข
ค่าเริ่มต้นกำหนด Reward/Risk ขั้นต่ำ 1.5 และเป้าหมายสำรอง 2R
ระบบไม่ข้ามโซนฝั่งตรงข้ามที่ใกล้ เพื่อเลือกเป้าหมายไกลที่ดูน่าสนใจกว่า หากพื้นที่ไม่พอจะงดสัญญาณ
ระดับตั้งต้นคงที่ระหว่างรอยืนยัน โซนใหม่ไม่เปลี่ยนเป้าหมายของจังหวะเดิม
ราคาอ้างอิงไม่ใช่ราคาที่รับประกันว่าจะซื้อขายได้จริง
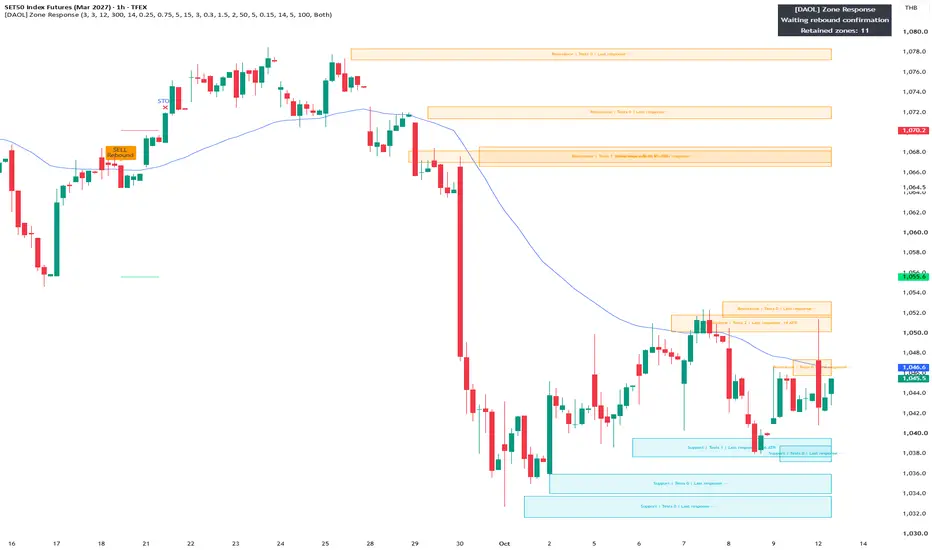
⏺️ Zone response information
Each zone displays:
🔹 Tests: Number of eligible test cycles after zone creation
🔹 Last response: Maximum favorable closing-price departure during the latest completed measurement window, expressed in ATR
A new test requires sufficient departure from the zone before returning. Consecutive bars inside the same zone are not counted as separate tests.
The default response window is five bars, including the test bar. The response is measured from the zone’s outer boundary using ATR frozen at the test.
These values describe observed price behavior. More tests or a larger response do not establish a higher probability of success.
⏺️ ข้อมูลการตอบสนองของโซน
แต่ละโซนแสดง:
🔹 Tests: จำนวนรอบทดสอบที่เข้าเงื่อนไขหลังสร้างโซน
🔹 Last response: ระยะสูงสุดที่ราคาปิดออกห่างจากขอบโซนในทิศทางที่สนับสนุนบทบาทของโซน ภายในช่วงวัดล่าสุดที่ครบแล้ว หน่วยเป็น ATR
ราคาต้องออกห่างตามเกณฑ์ก่อนกลับมาทดสอบใหม่ จึงไม่ได้นับแท่งที่ติดอยู่ในโซนต่อเนื่องเป็นหลายครั้ง
ค่าเริ่มต้นวัดห้าแท่ง รวมแท่งทดสอบ โดยใช้ ATR ที่ตรึงไว้เมื่อเริ่มทดสอบ
เป็นข้อมูลพฤติกรรมราคาที่เกิดขึ้นแล้ว ไม่ใช่คะแนนโอกาสชนะ และจำนวนครั้งที่มากขึ้นไม่ได้ยืนยันว่าโซนแข็งแรงขึ้นเสมอ
⏺️ Reading colors and completion markers
🔹 Aqua zone — support
🔹 Orange zone — resistance
🔹 Yellow zone — awaiting retest
🔹 White line — entry reference
🔹 Red line — fixed stop
🔹 Green line — fixed target
Tracking begins on the bar after the signal and continues until:
🔹 STOP: Only the stop is touched
🔹 TARGET: Only the target is touched
🔹 BOTH: Both levels are touched in one bar; the sequence is unknown
🔹 EXPIRE: The maximum tracking period is reached without either level being touched
The indicator tracks one signal at a time. SELL represents a short-direction setup, not an instruction to close an existing long position.
⏺️ อ่านสีและเครื่องหมายอย่างไร?
🔹 โซนฟ้า — แนวรับ
🔹 โซนส้ม — แนวต้าน
🔹 โซนเหลือง — รอ Retest
🔹 เส้นขาว — ราคาอ้างอิงเข้า
🔹 เส้นแดง — Stop ที่ตรึงไว้
🔹 เส้นเขียว — Target ที่ตรึงไว้
เริ่มตรวจระดับตั้งแต่แท่งถัดจากแท่งสัญญาณ จนเกิด:
🔹 STOP: แตะเฉพาะ Stop
🔹 TARGET: แตะเฉพาะ Target
🔹 BOTH: แตะทั้งสองระดับในแท่งเดียว ไม่ทราบลำดับ
🔹 EXPIRE: ครบระยะติดตามโดยยังไม่แตะทั้งสองระดับ
ระบบติดตามครั้งละหนึ่งสัญญาณ ส่วน SELL หมายถึงจังหวะฝั่ง Short ไม่ใช่คำสั่งปิด Long ที่ถืออยู่
เครื่องหมายแสดงการแตะระดับราคา ไม่ใช่ผลการจับคู่คำสั่งหรือกำไรขาดทุนจริง
⏺️ Settings and alerts
Key defaults:
🔹 Pivot left/right — 3 / 3 bars
🔹 Retained zones — 12
🔹 Zone lifetime — 300 bars from creation
🔹 ATR / RSI — 14 / 14
🔹 Zone half-width — 0.25 ATR
🔹 Departure requirement — 0.75 ATR
🔹 Response window — 5 bars
🔹 Retest window — 15 bars
🔹 Entry confirmation window — 3 subsequent bars
🔹 Trend EMA — 50
🔹 Stop buffer — 0.30 ATR
🔹 Tracking expiry — 100 subsequent bars
🔹 Cooldown — 5 complete bars
Choose Both, Rebound or Retest signal types.
Alerts are available for BUY, SELL, Rebound, Retest and tracking completion. Use “Once Per Bar Close” and recreate alerts after changing code or inputs.
⏺️ การตั้งค่าและ Alert
ค่าเริ่มต้นสำคัญ:
🔹 Pivot ซ้าย/ขวา — 3 / 3 แท่ง
🔹 เก็บโซน — 12 โซน
🔹 อายุโซน — 300 แท่งนับจากสร้าง
🔹 ATR / RSI — 14 / 14
🔹 ครึ่งความกว้างโซน — 0.25 ATR
🔹 ระยะออกห่างก่อนทดสอบใหม่ — 0.75 ATR
🔹 ช่วงวัดการตอบสนอง — 5 แท่ง
🔹 เวลารอ Retest — 15 แท่ง
🔹 เวลารอยืนยันเข้า — 3 แท่งถัดไป
🔹 Trend EMA — 50
🔹 ระยะเพิ่ม Stop — 0.30 ATR
🔹 หมดระยะติดตาม — 100 แท่งถัดไป
🔹 เว้นระยะหลังจบรอบ — 5 แท่งเต็ม
เลือกสัญญาณได้ทั้งสองรูปแบบ หรือเฉพาะ Rebound / Retest
มี Alert สำหรับ BUY, SELL, Rebound, Retest และสิ้นสุดการติดตาม ตั้ง Once Per Bar Close และสร้างใหม่หลังเปลี่ยนโค้ดหรือ Input
⏺️ Development and references
This Pine Script v6 implementation was written for this development without copying Community script source code.
It extends established support/resistance methods with test-cycle counting, completed response measurements, frozen setup references, opposing-zone room checks and single-signal tracking.
The underlying concepts are established methods. No claim is made that this combination is globally unique.
References:
🔹 J. Welles Wilder Jr. — New Concepts in Technical Trading Systems (1978): ATR and RSI
🔹 Confirmed swing pivots and support/resistance role reversal — standard technical-analysis concepts
TradingView — Average True Range
TradingView — Relative Strength Index
TradingView — Repainting and pivot timing
⏺️ การพัฒนาและอ้างอิง
เขียนด้วย Pine Script v6 สำหรับการพัฒนานี้ โดยไม่คัดลอกโค้ดจากสคริปต์ Community
ต่อยอดแนวรับ–แนวต้านด้วยการนับรอบทดสอบ การวัดการตอบสนองที่ครบช่วงแล้ว การตรึงจังหวะรอยืนยัน การตรวจพื้นที่ถึงโซนตรงข้าม และการติดตามครั้งละหนึ่งสัญญาณ
หลักการพื้นฐานมีอยู่เดิม ไม่อ้างว่าแนวคิดผสมนี้ไม่เคยมีผู้ทำมาก่อนทั้งหมด
⏺️ Limitations and disclaimer
🔹 Use standard price charts.
🔹 Pivot confirmation introduces a deliberate delay.
🔹 All windows are bar-based; changing timeframe changes their elapsed duration.
🔹 Overlapping zones can produce different interpretations. Response statistics do not determine signal eligibility or rank zone reliability in this version.
🔹 No TFEX-specific session filter or contract-roll adjustment is included.
🔹 Level touches do not account for fills, gaps, fees, slippage or liquidity.
🔹 No win rate or profitability has been established.
🔹 Static checks and basic numerical scenarios were completed; TradingView compilation and market-data validation remain pending.
🔹 For educational and informational purposes only. This indicator does not constitute personalized investment advice or guarantee returns.
⏺️ ข้อจำกัดและคำชี้แจง
🔹 ใช้กับกราฟราคามาตรฐาน
🔹 Pivot ต้องรอการยืนยัน จึงมีความล่าช้าตามจำนวนแท่งที่เลือก
🔹 ทุกช่วงนับเป็นแท่ง ระยะเวลาจริงเปลี่ยนเมื่อเปลี่ยน Timeframe
🔹 โซนซ้อนทับอาจตีความต่างกัน ในเวอร์ชันนี้สถิติการตอบสนองใช้แสดงข้อมูล ยังไม่ได้ใช้คัดสัญญาณหรือจัดอันดับความน่าเชื่อถือของโซน
🔹 ยังไม่มีตัวกรอง Session เฉพาะ TFEX หรือการปรับผลจากการเปลี่ยนสัญญา
🔹 การแตะระดับไม่ได้รวมราคาจับคู่จริง Gap ค่าธรรมเนียม Slippage หรือสภาพคล่อง
🔹 ยังไม่มีผลยืนยัน Win Rate หรือความสามารถในการทำกำไร
🔹 ตรวจโครงสร้างและสถานการณ์เชิงตัวเลขเบื้องต้นแล้ว แต่ยังไม่ได้ compile ใน TradingView หรือทดสอบข้อมูลตลาดจริง
🔹 ใช้เพื่อการศึกษาและประกอบการวิเคราะห์ ไม่ใช่คำแนะนำลงทุนเฉพาะบุคคลหรือการรับประกันผลตอบแทน
Convert to PDF
⋮⋮⋮⋮⋮⋮⋮⋮
[DAOL] Market Mode Signals identifies uptrend, downtrend, range and transition conditions, then applies different signal rules to each environment.
It combines EMA alignment and slope, DMI/ADX, Kaufman’s Efficiency Ratio and a prior-bar price channel. ATR adjusts setup tolerances and stop buffers to recent volatility.
The indicator displays confirmed BUY/SELL signals and tracks one signal at a time using fixed reference, stop and target levels.
It is an indicator, not an order execution system or a Strategy Tester backtest.
⏺️ Indicator นี้คืออะไร?
[DAOL] Market Mode Signals เป็นอินดิเคเตอร์ที่แยกสภาวะตลาดเป็น ขาขึ้น ขาลง ไซด์เวย์ และช่วงเปลี่ยนผ่าน แล้วเลือกเงื่อนไขสัญญาณให้เหมาะกับแต่ละสภาวะ
ผสมหลักการ EMA, DMI/ADX, Efficiency Ratio และกรอบราคาจากแท่งก่อนหน้า พร้อมใช้ ATR ปรับระยะตามความผันผวน
แสดงสัญญาณ BUY/SELL เมื่อแท่งปิดยืนยัน และติดตามครั้งละหนึ่งรอบ พร้อมตรึงราคาอ้างอิง Stop และ Target
เป็นอินดิเคเตอร์สำหรับประกอบการวิเคราะห์ ไม่ได้ส่งคำสั่งซื้อขายหรือแสดงผล Backtest ใน Strategy Tester
⏺️ How are market conditions classified?
🔹 UPTREND: Fast EMA above slow EMA, rising slow EMA, +DI above −DI, and ADX/ER meeting the trend thresholds.
🔹 DOWNTREND: Fast EMA below slow EMA, falling slow EMA, −DI above +DI, and ADX/ER meeting the trend thresholds.
🔹 RANGE: Both ADX and ER at or below their range thresholds.
🔹 TRANSITION: None of the above conditions is satisfied.
By default, a condition must persist for two consecutive closed bars before becoming the confirmed market mode. New setups also require the current classification to agree with that confirmed mode.
ADX measures trend strength; the EMA and DI conditions determine direction.
⏺️ แยกสภาวะตลาดอย่างไร?
🔹 UPTREND: EMA สั้นอยู่เหนือ EMA ยาว เส้นยาวมีความชันขึ้น +DI มากกว่า −DI และ ADX/ER ผ่านเกณฑ์แนวโน้ม
🔹 DOWNTREND: EMA สั้นอยู่ใต้ EMA ยาว เส้นยาวมีความชันลง −DI มากกว่า +DI และ ADX/ER ผ่านเกณฑ์แนวโน้ม
🔹 RANGE: ADX และ ER ต่ำกว่าหรือเท่ากับเกณฑ์ไซด์เวย์ทั้งคู่
🔹 TRANSITION: เงื่อนไขไม่เข้ากลุ่มข้างต้น ระบบงดสร้างจังหวะใหม่
ค่าเริ่มต้นรอสภาวะเดียวกัน สองแท่งปิดต่อเนื่อง ก่อนยืนยันโหมด และเงื่อนไขปัจจุบันต้องตรงกับโหมดยืนยันจึงจะเริ่มสร้างจังหวะได้
ADX ใช้อ่านความแข็งแรงของแนวโน้ม ส่วน EMA และ DI ใช้อ่านทิศทาง
⏺️ How are signals generated?
Trend signals
In an uptrend, price must test the fast EMA area and close back above it with a bullish body, while respecting the slow EMA conditions. A subsequent bar must close above the setup close with a bullish body.
The downtrend signal uses the opposite conditions.
Range signals
In a range, price must test the lower or upper channel area and close inside the channel with a directional body:
🔹 Lower-area rejection → potential BUY setup
🔹 Upper-area rejection → potential SELL setup
A subsequent bar must close further in the proposed direction with a matching candle body. The target is the frozen channel midpoint, and the signal must satisfy the minimum reward-to-risk requirement.
Both signal types require confirmation within the setup expiry window and within one frozen ATR of the setup close. A setup is cancelled if its stop boundary is touched, the market classification changes, or the setup expires. Range setups are also cancelled if price closes at or beyond either frozen channel boundary.
⏺️ สัญญาณเกิดขึ้นอย่างไร?
สัญญาณตามแนวโน้ม
ตลาดขาขึ้น: ราคาทดสอบบริเวณ EMA สั้น แล้วปิดกลับเหนือเส้นด้วยแท่งขึ้น โดยยังผ่านเงื่อนไข EMA ยาว จากนั้นรอแท่งถัดไปปิดสูงกว่าราคาปิดของแท่งตั้งต้น พร้อมเป็นแท่งขึ้น
ตลาดขาลง: ใช้เงื่อนไขตรงข้าม เพื่อรอราคาเด้งแล้วอ่อนตัวต่อ
สัญญาณไซด์เวย์
ราคาทดสอบบริเวณขอบกรอบ แล้วปิดกลับอยู่ภายในกรอบด้วยแท่งที่สนับสนุนทิศทาง:
🔹 ทดสอบขอบล่างแล้วฟื้น → รอ BUY
🔹 ทดสอบขอบบนแล้วอ่อนตัว → รอ SELL
จากนั้นรอแท่งยืนยันปิดเดินหน้าต่อในทิศทางนั้น โดย เป้าหมายอยู่ที่กึ่งกลางกรอบที่ตรึงไว้ และต้องมี Reward/Risk ผ่านเกณฑ์ขั้นต่ำ
ทั้งสองรูปแบบต้องยืนยันภายในเวลาที่กำหนด และราคายืนยันต้องห่างจากราคาปิดแท่งตั้งต้นไม่เกินหนึ่ง ATR ที่ตรึงไว้
ระบบยกเลิกจังหวะเมื่อแตะขอบเขต Stop สภาวะตลาดเปลี่ยน หรือหมดเวลารอยืนยัน สำหรับจังหวะไซด์เวย์จะยกเลิกเพิ่มเติมเมื่อราคาปิดถึงหรือออกนอกขอบกรอบที่ตรึงไว้
⏺️ Reading the chart
🔹 BUY Trend / SELL Trend: Confirmed trend-pullback signal
🔹 BUY Range / SELL Range: Confirmed range-rebound signal
🔹 White line: Signal closing-price reference
🔹 Red line: Fixed stop reference
🔹 Green line: Fixed target reference
Background colors show the confirmed market mode:
🔹 Green — uptrend
🔹 Red — downtrend
🔹 Aqua — range
🔹 Gray — transition
BUY indicates a long-direction setup. SELL indicates a short-direction setup, not an instruction to close an existing long position.
⏺️ วิธีอ่านกราฟ
🔹 BUY Trend / SELL Trend: สัญญาณย่อหรือเด้งตามแนวโน้มที่ยืนยันแล้ว
🔹 BUY Range / SELL Range: สัญญาณฟื้นหรืออ่อนตัวจากขอบกรอบไซด์เวย์ที่ยืนยันแล้ว
🔹 เส้นขาว: ราคาปิดของแท่งสัญญาณ ใช้เป็นราคาอ้างอิง
🔹 เส้นแดง: ระดับ Stop ที่ตรึงไว้
🔹 เส้นเขียว: ระดับ Target ที่ตรึงไว้
สีพื้นหลังแสดงโหมดตลาดที่ยืนยัน:
🔹 เขียว — ขาขึ้น
🔹 แดง — ขาลง
🔹 ฟ้า — ไซด์เวย์
🔹 เทา — ช่วงเปลี่ยนผ่าน
BUY หมายถึงจังหวะฝั่ง Long ส่วน SELL หมายถึงจังหวะฝั่ง Short ไม่ใช่คำสั่งปิด Long ที่ถืออยู่
⏺️ Signal tracking and reference levels
The entry reference is the signal bar’s close. It is not a guaranteed execution price.
The stop is placed beyond the setup bar’s low or high, with a frozen ATR buffer and tick-size rounding.
🔹 Trend target — two times the reference risk by default
🔹 Range target — the frozen channel midpoint
🔹 Range minimum reward/risk — 1.2 by default
Tracking begins on the bar after the signal. Levels remain fixed, and a change in market mode alone does not end an active signal.
Tracking ends when:
🔹 STOP: Only the stop level is touched
🔹 TARGET: Only the target level is touched
🔹 BOTH: Both levels are touched within one bar; their order is unknown
🔹 EXPIRE: Neither level has been touched within the maximum tracking period
These markers describe price-level touches. They do not calculate realized returns or order fills.
⏺️ การติดตามสัญญาณและระดับอ้างอิง
ราคาอ้างอิงเข้าคือ ราคาปิดแท่งสัญญาณ ไม่ใช่ราคาที่รับประกันว่าจะซื้อขายได้จริง
Stop อยู่เลยจุดต่ำหรือสูงของแท่งตั้งต้น โดยเพิ่มระยะ ATR ที่ตรึงไว้ และปรับตามขนาด Tick
🔹 เป้าหมาย Trend — ค่าเริ่มต้นสองเท่าของระยะเสี่ยงอ้างอิง
🔹 เป้าหมาย Range — กึ่งกลางกรอบที่ตรึงไว้
🔹 Reward/Risk ขั้นต่ำของ Range — ค่าเริ่มต้น 1.2
เริ่มตรวจระดับตั้งแต่ แท่งถัดจากแท่งสัญญาณ ระดับจะคงที่ และการเปลี่ยนโหมดตลาดเพียงอย่างเดียวไม่ทำให้รอบที่ติดตามอยู่สิ้นสุด
เครื่องหมายสิ้นสุดรอบ:
🔹 STOP: แตะเฉพาะระดับ Stop
🔹 TARGET: แตะเฉพาะระดับ Target
🔹 BOTH: แตะทั้งสองระดับในแท่งเดียว ไม่ทราบว่าแตะระดับใดก่อน
🔹 EXPIRE: ยังไม่แตะระดับใดเมื่อครบระยะติดตาม
เครื่องหมายเหล่านี้แสดงการแตะระดับราคา ไม่ใช่ผลกำไรขาดทุนหรือการจับคู่คำสั่งซื้อขายจริง
⏺️ Settings and alerts
Signal modes:
🔹 Auto: Allow trend and range signals according to market conditions
🔹 Trend Only: Allow trend signals only
🔹 Range Only: Allow range signals only
Key defaults:
🔹 EMA — 20 / 50
🔹 DMI/ADX — 14
🔹 Efficiency Ratio — 20
🔹 Trend thresholds — ADX ≥ 22 and ER ≥ 0.30
🔹 Range thresholds — ADX ≤ 18 and ER ≤ 0.20
🔹 Prior-bar channel — 40 bars
🔹 ATR — 14, using the preceding bar’s value
🔹 Market confirmation — 2 closed bars
🔹 Setup confirmation window — up to 3 subsequent bars
🔹 Tracking expiry — 80 subsequent bars
🔹 Cooldown — 5 complete bars after tracking ends
Alerts are available for each signal type, any BUY, any SELL and tracking completion. Set alerts to “Once Per Bar Close” and recreate them after changing inputs or code.
⏺️ การตั้งค่าและ Alert
เลือกโหมดได้:
🔹 Auto: ใช้ทั้งสัญญาณ Trend และ Range ตามสภาวะตลาด
🔹 Trend Only: ใช้เฉพาะสัญญาณตามแนวโน้ม
🔹 Range Only: ใช้เฉพาะสัญญาณไซด์เวย์
ค่าเริ่มต้นสำคัญ:
🔹 EMA — 20 / 50
🔹 DMI/ADX — 14
🔹 Efficiency Ratio — 20
🔹 เกณฑ์ Trend — ADX ≥ 22 และ ER ≥ 0.30
🔹 เกณฑ์ Range — ADX ≤ 18 และ ER ≤ 0.20
🔹 กรอบราคาจากแท่งก่อนหน้า — 40 แท่ง
🔹 ATR — 14 ใช้ค่าจากแท่งก่อนหน้า
🔹 ยืนยันโหมด — 2 แท่งปิด
🔹 รอยืนยันจังหวะ — ไม่เกิน 3 แท่งถัดไป
🔹 หมดระยะติดตาม — 80 แท่งถัดไป
🔹 เว้นระยะหลังจบรอบ — 5 แท่งเต็ม
มี Alert แยกตามประเภทสัญญาณ รวม BUY รวม SELL และเมื่อสิ้นสุดการติดตาม ตั้งเป็น Once Per Bar Close และสร้าง Alert ใหม่หลังเปลี่ยน Input หรือโค้ด
⏺️ Development and references
This Pine Script v6 implementation was written for this indicator without copying Community script code.
The extension combines market-mode confirmation, mode-specific setups, frozen setup references, cancellation rules and single-signal tracking.
The underlying EMA, DMI/ADX, ATR, Efficiency Ratio and price-channel concepts are established methods. No claim is made that the combination is globally unique or that it guarantees profitable signals.
References:
🔹 J. Welles Wilder Jr. — New Concepts in Technical Trading Systems (1978): Directional Movement, ADX and ATR
🔹 Perry J. Kaufman — Trading Systems and Methods: Efficiency Ratio
🔹 Donchian-style channels: historical highest-high and lowest-low references
Supporting documentation:
TradingView — Directional Movement
TradingView — Average True Range
TradingView — Kaufman’s Adaptive Moving Average
⏺️ การพัฒนาและอ้างอิง
เขียนด้วย Pine Script v6 สำหรับอินดิเคเตอร์นี้ โดยไม่คัดลอกโค้ดจากสคริปต์ Community
ส่วนที่พัฒนาต่อยอดคือการยืนยันโหมดตลาด การเลือกเงื่อนไขตามโหมด การตรึงระดับตั้งต้น การยกเลิกจังหวะที่ผิดเงื่อนไข และการติดตามครั้งละหนึ่งรอบ
EMA, DMI/ADX, ATR, Efficiency Ratio และกรอบราคาย้อนหลังเป็นหลักการที่มีอยู่แล้ว ไม่อ้างว่าแนวคิดผสมนี้ไม่เคยมีผู้ทำมาก่อน หรือรับประกันว่าสัญญาณจะทำกำไร
⏺️ Limitations and disclaimer
🔹 Use standard price charts. Synthetic chart types are rejected.
🔹 Settings are measured in bars; changing timeframe changes the elapsed time represented by each window.
🔹 The indicator has no TFEX-specific session filter, contract-roll handling or optimized S50/GO presets.
🔹 Market classification can lag or misclassify changing conditions.
🔹 Fixed stop and target references do not account for slippage, fees, gaps, liquidity or actual execution.
🔹 No win rate, profit factor or expected return has been established.
🔹 Static checks and basic level arithmetic were completed. TradingView compilation and market-data validation remain pending.
🔹 For educational and informational purposes only. Signals are analytical conditions, not personalized investment advice or guaranteed outcomes.
⏺️ ข้อจำกัดและคำชี้แจง
🔹 ใช้กับกราฟราคามาตรฐาน ระบบไม่รองรับกราฟราคาสังเคราะห์
🔹 การตั้งค่านับเป็นแท่ง เมื่อเปลี่ยน Timeframe ระยะเวลาจริงของแต่ละช่วงจะเปลี่ยนตาม
🔹 เวอร์ชันนี้ยังไม่มีตัวกรอง Session ของ TFEX การจัดการเปลี่ยนสัญญา หรือค่าที่ผ่านการปรับทดสอบเฉพาะ S50/GO
🔹 การจำแนกตลาดอาจล่าช้าหรือคลาดเคลื่อนเมื่อสภาวะเปลี่ยน
🔹 Stop/Target อ้างอิงไม่ได้รวม Slippage ค่าธรรมเนียม Gap สภาพคล่อง หรือการส่งคำสั่งจริง
🔹 ยังไม่มีผลยืนยัน Win Rate, Profit Factor หรือผลตอบแทนคาดหวัง
🔹 ตรวจโครงสร้างเบื้องต้นและสูตรระดับราคาแล้ว แต่ยังไม่ได้ compile ใน TradingView หรือทดสอบข้อมูลตลาดจริง
🔹 ใช้เพื่อการศึกษาและประกอบการวิเคราะห์ สัญญาณเป็นเงื่อนไขทางเทคนิค ไม่ใช่คำแนะนำลงทุนเฉพาะบุคคลหรือการรับประกันผลลัพธ์
Convert to PDF
ขอหมวดหมู่และแท็ก
สำหรับ [DAOL] Market Mode Signals
หมวดหมู่: Trend Analysis
เพราะใช้จำแนกแนวโน้มและไซด์เวย์ เพื่อเลือกเงื่อนไขสัญญาณ BUY/SELL
แท็กแนะนำ:
trendanalysis · buyandsell · marketregime · meanreversion · pullback
แท็กเหล่านี้ครอบคลุมทั้งการแยกสภาวะตลาด สัญญาณตามแนวโน้ม และสัญญาณกลับตัวภายในกรอบครับ
Convert to PDF
ขออินดิเคเตอร์ที่ช่วยบอกแนวรับแนวต้าน จุดเข้าหรือจุดออก และมีการพัฒนาต่อยอดใหม่ๆ อาจจะมีการใช้ อินดิเคเตอร์ในการวัดจุดเข้า จุดออก ก็ได้ ลองทำมาให้หน่อย
ผมเสนอ [DAOL] Zone Response — แนวรับแนวต้าน พร้อมจังหวะเข้าและออก ครับ
ตัวนี้ใช้ พฤติกรรมราคาที่ตอบสนองต่อโซน เป็นหลัก โดยแสดงโซนแนวรับ–แนวต้าน แล้วรอยืนยันว่า “ราคาปฏิเสธโซน” หรือ “ทะลุและยืนได้” ก่อนออกสัญญาณ
1. สร้างโซนแนวรับ–แนวต้าน
ใช้จุดสูงและต่ำแบบ Confirmed Swing Pivot แล้วเพิ่มความกว้างด้วย ATR เพื่อแสดงเป็นพื้นที่แทนเส้นราคาเดียว
โซนจะเริ่มใช้งานเมื่อ Pivot ยืนยันแล้วเท่านั้น เช่น ตั้งด้านขวา 3 แท่ง จะรู้จุดสวิงหลังผ่านไป 3 แท่ง ไม่วาดสัญญาณเข้าย้อนกลับไปที่จุดสวิง เพราะอาจทำให้ผู้ใช้เข้าใจผิดว่าเห็นจุดนั้นได้ล่วงหน้า
2. สัญญาณเข้ามีสองรูปแบบ
รูปแบบ BUY / Long SELL / Short
Zone Rebound ราคาทดสอบแนวรับ ปิดกลับเหนือขอบโซน แล้วแท่งถัดไปปิดสูงขึ้น พร้อม RSI ฟื้น ราคาทดสอบแนวต้าน ปิดกลับใต้ขอบโซน แล้วแท่งถัดไปปิดต่ำลง พร้อม RSI อ่อนตัว
Break & Retest ปิดทะลุแนวต้าน แล้วกลับมาทดสอบจากด้านบนและปิดยืนเหนือโซน ปิดหลุดแนวรับ แล้วกลับมาทดสอบจากด้านล่างและปิดอยู่ใต้โซน
ใช้ EMA และความชัน กรองทิศทางสำหรับ Break & Retest ส่วน Rebound จะหลีกเลี่ยงการสวนแนวโน้มที่ชัดเจน โดยไม่ใช้ RSI แตะเขต Overbought/Oversold เป็นสัญญาณเข้าเพียงอย่างเดียว
3. แสดงจุดออกตามโครงสร้างราคา
เมื่อเกิดสัญญาณ ระบบตรึงราคาอ้างอิงและระดับความเสี่ยงของรอบนั้น:
Entry Reference: ราคาปิดแท่งยืนยัน
Stop: เลยขอบโซนหรือจุดสุดขั้วของจังหวะตั้งต้น โดยเพิ่มระยะ ATR
Target: ขอบใกล้ของโซนฝั่งตรงข้ามที่มีอยู่แล้ว ณ เวลาสัญญาณ
กรณีไม่มีโซนเป้าหมาย: ใช้เป้าหมายตามระยะเสี่ยง เช่น 2R และระบุว่าเป็น R Target
Room Filter: งดสัญญาณหากเป้าหมายใกล้เกินไป เช่น Reward/Risk ต่ำกว่า 1.5
ATR ใช้ปรับระยะตามความผันผวน ไม่ได้บอกทิศทางราคาด้วยตัวเอง
4. ส่วนที่พัฒนาต่อยอด
ตัวนี้จะเพิ่ม ประวัติการตอบสนองของแต่ละโซน โดยนับการทดสอบเป็น “รอบ” ราคาต้องออกห่างจากโซนก่อนจึงนับการกลับมาทดสอบใหม่ เพื่อไม่ให้นับแท่งที่ติดอยู่ในโซนเป็นหลายครั้ง
แต่ละโซนแสดงข้อมูลสามอย่าง:
ข้อมูล ความหมาย
Test Count จำนวนรอบที่ราคากลับมาทดสอบหลังโซนเริ่มใช้งาน
Response Distance ราคาถอยห่างจากโซนได้มากแค่ไหนในช่วงติดตาม วัดเป็น ATR
Role แนวรับ แนวต้าน หรือโซนทะลุที่กำลังรอ Retest
จะไม่ตีความว่า “ทดสอบหลายครั้ง = แข็งแรงขึ้นเสมอ” เพราะการทดสอบซ้ำอาจนำไปสู่การทะลุได้ ข้อมูลนี้ใช้ประกอบการอ่านโซน ไม่ใช่เปอร์เซ็นต์โอกาสชนะ
เมื่อเริ่มรอจังหวะเข้า จะตรึงโซนและ ATR ของจังหวะนั้น หากราคาผิดเงื่อนไขหรือรอนานเกินกำหนด ระบบยกเลิกจังหวะ ส่วนโซนใหม่ที่เกิดภายหลังจะไม่เปลี่ยน Stop/Target ของสัญญาณเดิม
ภาพบนกราฟ
🟦 โซนแนวรับ · 🟧 โซนแนวต้าน
🟢 BUY Rebound / BUY Retest · 🔴 SELL Rebound / SELL Retest
เส้นราคาอ้างอิงเข้า พร้อม Stop และ Target และ Alert เมื่อยืนยันหรือแตะระดับออก
ที่มาของหลักการ
Swing Pivot และแนวรับ–แนวต้าน: หลักการโครงสร้างราคามาตรฐาน โดยใช้ Pivot ที่ยืนยันแล้ว
J. Welles Wilder Jr., New Concepts in Technical Trading Systems (1978): ATR และ RSI
Breakout / Retest และการสลับบทบาทแนวรับ–แนวต้าน: หลักการวิเคราะห์ราคาที่มีอยู่เดิม
ส่วนที่เสนอพัฒนาเพิ่มคือ การบันทึกการตอบสนองเป็นรายโซน การนับรอบทดสอบ การตรึงจังหวะรอยืนยัน และการเลือกเป้าหมายจากพื้นที่ที่เหลือจริง ไม่อ้างว่าแนวคิดทั้งหมดเป็นของใหม่หรือไม่เคยมีงานคล้ายกันใน Community
แนวทางนี้รองรับการนำไปทดสอบกับ S50 / GO ได้ แต่ยังไม่มีผลยืนยันว่าค่าใดเหมาะกับแต่ละ Timeframe หรือให้ผลตอบแทนดีครับ
Convert to PDF
ขอ Pine Script
ได้ครับ [DAOL] Zone Response — Pine Script v6 ฉบับเต็ม
📄
DAOL_Zone_Response_v1.pine
เปิดไฟล์แล้วคัดลอกทั้งหมดไปที่ Pine Editor → Save → Add to chart
ฟีเจอร์ที่ใส่ให้:
โซนแนวรับ–แนวต้าน จาก Pivot ที่ยืนยันแล้ว พร้อมความกว้างตาม ATR
BUY/SELL Rebound — ทดสอบโซนแล้วเด้ง พร้อมแท่งยืนยันและ RSI
BUY/SELL Retest — ทะลุโซนแล้วกลับมาทดสอบ ใช้ EMA และความชันกรองทิศทาง
Entry / Stop / Target ตรึงระดับของแต่ละสัญญาณ
Room Filter งดสัญญาณเมื่อ Reward/Risk ต่ำกว่าเกณฑ์
Test Count / Response Distance จำนวนรอบทดสอบและระยะตอบสนองล่าสุดเป็น ATR
Alerts สำหรับสัญญาณเข้าและสิ้นสุดการติดตาม
สีฟ้าคือแนวรับ สีส้มคือแนวต้าน สีเหลืองคือโซนที่ทะลุแล้วรอ Retest ส่วน BOTH หมายถึงแท่งเดียวแตะทั้ง Stop และ Target โดยไม่ทราบลำดับ
อ้างอิงแนวคิด Swing Pivot, การสลับบทบาทแนวรับ–แนวต้าน และ ATR/RSI ของ Wilder พร้อมแนบที่มาในโค้ด
ตรวจโครงสร้างและสูตรเบื้องต้นแล้ว แต่ยังไม่ได้ compile ใน TradingView หรือทดสอบข้อมูล S50/GO จริง ตัวนี้เป็นอินดิเคเตอร์ติดตามสัญญาณ ยังไม่มีผล Backtest หรือราคาจับคู่คำสั่งจริงครับ
Convert to PDF
ขอคำอธิบาย
[DAOL] Zone Response — Support, Resistance and Confirmed Entry Signals
⏺️ What is it?
[DAOL] Zone Response maps support and resistance zones from confirmed swing pivots, then evaluates how price responds to those zones.
It provides two signal types:
🔹 Rebound — price tests a zone and closes back on its supporting side
🔹 Retest — price breaks a zone, moves away, then returns to test its new role
Signals require subsequent closed-bar confirmation, RSI direction and sufficient room to the target. Each confirmed signal includes fixed entry-reference, stop and target levels.
This is an analytical indicator, not an automated execution system or a Strategy Tester backtest.
⏺️ Indicator นี้คืออะไร?
[DAOL] Zone Response แสดง โซนแนวรับ–แนวต้านจากจุดสวิงที่ยืนยันแล้ว พร้อมตรวจสอบว่าราคาตอบสนองต่อโซนอย่างไร
แบ่งสัญญาณเป็นสองรูปแบบ:
🔹 Rebound — ราคาทดสอบโซน แล้วปิดกลับออกมาฝั่งที่สนับสนุนการเด้ง
🔹 Retest — ราคาทะลุโซน ออกห่าง แล้วกลับมาทดสอบบทบาทใหม่ของโซน
สัญญาณต้องผ่านแท่งปิดยืนยัน ทิศทาง RSI และพื้นที่ถึงเป้าหมาย จากนั้นแสดงราคาอ้างอิงเข้า Stop และ Target ที่ตรึงไว้
เป็นอินดิเคเตอร์สำหรับประกอบการวิเคราะห์ ไม่ได้ส่งคำสั่งซื้อขายอัตโนมัติหรือแสดงผล Backtest ใน Strategy Tester
⏺️ How are zones created?
Zones are centered on confirmed pivot highs and lows:
🔹 Pivot low → support zone
🔹 Pivot high → resistance zone
Zone width is determined by ATR at confirmation and remains fixed.
With the default three right-side confirmation bars, a pivot becomes known three bars after the swing point. The zone begins at the confirmation bar, not at the earlier pivot bar.
Zones are maintained individually; nearby or overlapping zones are not merged. Old zones are removed when their lifetime expires or the maximum retained-zone count is exceeded.
⏺️ สร้างโซนอย่างไร?
ใช้จุดสูงและต่ำแบบ Pivot ที่ยืนยันแล้ว:
🔹 Pivot Low → โซนแนวรับ
🔹 Pivot High → โซนแนวต้าน
ความกว้างของโซนคำนวณจาก ATR เมื่อยืนยัน และคงที่หลังสร้าง
ค่าเริ่มต้นใช้แท่งด้านขวาสามแท่ง จึงรู้จุดสวิง หลังจากจุดนั้นผ่านไปสามแท่ง โซนเริ่มแสดงเมื่อยืนยัน ไม่ย้อนจุดเริ่มต้นไปที่แท่งสวิง
แต่ละโซนเก็บแยกกัน ไม่รวมโซนใกล้เคียงหรือซ้อนทับ โซนเก่าจะถูกนำออกเมื่อหมดอายุหรือเกินจำนวนที่กำหนด
⏺️ Rebound signals
BUY Rebound
Price returns to an eligible support zone.
The setup bar closes above the zone with a bullish body.
The EMA slope filter does not indicate a strong opposing downtrend.
A subsequent bar closes above the setup close with a bullish body and rising RSI.
SELL Rebound
The conditions are reversed at resistance, with a bearish body and falling RSI.
A rebound setup does not require RSI to enter or leave fixed overbought/oversold levels.
⏺️ สัญญาณ Rebound
BUY Rebound
ราคากลับมาทดสอบโซนแนวรับที่พร้อมรับการทดสอบรอบใหม่
แท่งตั้งต้นปิดเหนือโซนและเป็นแท่งขึ้น
ความชัน EMA ไม่แสดงแนวโน้มลงสวนทางที่แรงเกินเกณฑ์
แท่งถัดไปปิดสูงกว่าราคาปิดแท่งตั้งต้น เป็นแท่งขึ้น และ RSI เพิ่มขึ้น
SELL Rebound
ใช้เงื่อนไขตรงข้ามบริเวณแนวต้าน โดยรอแท่งลงและ RSI ลดลง
ไม่ได้ใช้ RSI เข้า–ออกเขต Overbought/Oversold เป็นเงื่อนไขหลักของสัญญาณ
⏺️ Break and retest signals
A close above resistance changes the zone to “Await retest” for potential support. A close below support changes it to “Await retest” for potential resistance.
Price must move sufficiently away from the zone before a return can qualify as a new test.
🔹 BUY Retest: Return to the broken resistance zone, close above it with a bullish body, and satisfy the above-EMA and rising-EMA conditions
🔹 SELL Retest: Return to the broken support zone, close below it with a bearish body, and satisfy the below-EMA and falling-EMA conditions
The setup then requires subsequent price and RSI confirmation.
A zone’s new support/resistance role is established when the retest setup conditions are met; this does not guarantee that a final entry signal will follow.
An awaiting-retest zone is removed if its retest window expires or price closes through the opposite boundary.
⏺️ สัญญาณ Break & Retest
เมื่อราคาปิดทะลุแนวต้าน โซนจะเปลี่ยนเป็น Await retest เพื่อรอทดสอบเป็นแนวรับ ส่วนการปิดหลุดแนวรับจะรอทดสอบเป็นแนวต้าน
ราคาต้องออกห่างจากโซนตามเกณฑ์ก่อน การกลับมาจึงนับเป็นการทดสอบรอบใหม่
🔹 BUY Retest: กลับมาทดสอบแนวต้านเดิม ปิดเหนือโซนด้วยแท่งขึ้น ราคาอยู่เหนือ EMA และ EMA มีความชันขึ้น
🔹 SELL Retest: กลับมาทดสอบแนวรับเดิม ปิดใต้โซนด้วยแท่งลง ราคาอยู่ใต้ EMA และ EMA มีความชันลง
จากนั้นรอแท่งถัดไปยืนยันด้วยราคาและทิศทาง RSI
โซนจะรับบทบาทใหม่เมื่อผ่านเงื่อนไขตั้งต้นของ Retest แต่ไม่ได้รับประกันว่าจะเกิดสัญญาณเข้าที่ผ่านการยืนยันในภายหลัง
หากหมดเวลารอ Retest หรือราคาปิดทะลุขอบอีกฝั่ง ระบบจะนำโซนที่รอทดสอบนั้นออก
⏺️ Entry, stop and target
🔹 Entry Reference: Closing price of the confirmed signal bar
🔹 Stop: Beyond the setup bar’s extreme or zone boundary, whichever is farther, plus a frozen ATR buffer
🔹 Zone Target: Near edge of the closest eligible opposing zone known when the setup was created
🔹 R Target: Risk-multiple target when no eligible opposing zone exists
The default minimum reward/risk is 1.5. The fallback target is 2R.
The indicator does not skip a nearby opposing zone to select a more attractive distant target. If the available room is insufficient, no signal is issued.
Setup references remain fixed while awaiting confirmation. New zones do not replace the target of that setup.
⏺️ จุดเข้า Stop และ Target
🔹 Entry Reference: ราคาปิดแท่งสัญญาณที่ยืนยันแล้ว
🔹 Stop: เลยจุดสุดขั้วของแท่งตั้งต้นหรือขอบโซน โดยเลือกด้านที่ไกลกว่า แล้วเพิ่มระยะ ATR ที่ตรึงไว้
🔹 Zone Target: ขอบใกล้ของโซนฝั่งตรงข้ามที่ใกล้ที่สุดและเข้าเงื่อนไข ณ เวลาสร้างจังหวะ
🔹 R Target: เป้าหมายตามระยะเสี่ยง เมื่อไม่มีโซนฝั่งตรงข้ามที่เข้าเงื่อนไข
ค่าเริ่มต้นกำหนด Reward/Risk ขั้นต่ำ 1.5 และเป้าหมายสำรอง 2R
ระบบไม่ข้ามโซนฝั่งตรงข้ามที่ใกล้ เพื่อเลือกเป้าหมายไกลที่ดูน่าสนใจกว่า หากพื้นที่ไม่พอจะงดสัญญาณ
ระดับตั้งต้นคงที่ระหว่างรอยืนยัน โซนใหม่ไม่เปลี่ยนเป้าหมายของจังหวะเดิม
ราคาอ้างอิงไม่ใช่ราคาที่รับประกันว่าจะซื้อขายได้จริง
⏺️ Zone response information
Each zone displays:
🔹 Tests: Number of eligible test cycles after zone creation
🔹 Last response: Maximum favorable closing-price departure during the latest completed measurement window, expressed in ATR
A new test requires sufficient departure from the zone before returning. Consecutive bars inside the same zone are not counted as separate tests.
The default response window is five bars, including the test bar. The response is measured from the zone’s outer boundary using ATR frozen at the test.
These values describe observed price behavior. More tests or a larger response do not establish a higher probability of success.
⏺️ ข้อมูลการตอบสนองของโซน
แต่ละโซนแสดง:
🔹 Tests: จำนวนรอบทดสอบที่เข้าเงื่อนไขหลังสร้างโซน
🔹 Last response: ระยะสูงสุดที่ราคาปิดออกห่างจากขอบโซนในทิศทางที่สนับสนุนบทบาทของโซน ภายในช่วงวัดล่าสุดที่ครบแล้ว หน่วยเป็น ATR
ราคาต้องออกห่างตามเกณฑ์ก่อนกลับมาทดสอบใหม่ จึงไม่ได้นับแท่งที่ติดอยู่ในโซนต่อเนื่องเป็นหลายครั้ง
ค่าเริ่มต้นวัดห้าแท่ง รวมแท่งทดสอบ โดยใช้ ATR ที่ตรึงไว้เมื่อเริ่มทดสอบ
เป็นข้อมูลพฤติกรรมราคาที่เกิดขึ้นแล้ว ไม่ใช่คะแนนโอกาสชนะ และจำนวนครั้งที่มากขึ้นไม่ได้ยืนยันว่าโซนแข็งแรงขึ้นเสมอ
⏺️ Reading colors and completion markers
🔹 Aqua zone — support
🔹 Orange zone — resistance
🔹 Yellow zone — awaiting retest
🔹 White line — entry reference
🔹 Red line — fixed stop
🔹 Green line — fixed target
Tracking begins on the bar after the signal and continues until:
🔹 STOP: Only the stop is touched
🔹 TARGET: Only the target is touched
🔹 BOTH: Both levels are touched in one bar; the sequence is unknown
🔹 EXPIRE: The maximum tracking period is reached without either level being touched
The indicator tracks one signal at a time. SELL represents a short-direction setup, not an instruction to close an existing long position.
⏺️ อ่านสีและเครื่องหมายอย่างไร?
🔹 โซนฟ้า — แนวรับ
🔹 โซนส้ม — แนวต้าน
🔹 โซนเหลือง — รอ Retest
🔹 เส้นขาว — ราคาอ้างอิงเข้า
🔹 เส้นแดง — Stop ที่ตรึงไว้
🔹 เส้นเขียว — Target ที่ตรึงไว้
เริ่มตรวจระดับตั้งแต่แท่งถัดจากแท่งสัญญาณ จนเกิด:
🔹 STOP: แตะเฉพาะ Stop
🔹 TARGET: แตะเฉพาะ Target
🔹 BOTH: แตะทั้งสองระดับในแท่งเดียว ไม่ทราบลำดับ
🔹 EXPIRE: ครบระยะติดตามโดยยังไม่แตะทั้งสองระดับ
ระบบติดตามครั้งละหนึ่งสัญญาณ ส่วน SELL หมายถึงจังหวะฝั่ง Short ไม่ใช่คำสั่งปิด Long ที่ถืออยู่
เครื่องหมายแสดงการแตะระดับราคา ไม่ใช่ผลการจับคู่คำสั่งหรือกำไรขาดทุนจริง
⏺️ Settings and alerts
Key defaults:
🔹 Pivot left/right — 3 / 3 bars
🔹 Retained zones — 12
🔹 Zone lifetime — 300 bars from creation
🔹 ATR / RSI — 14 / 14
🔹 Zone half-width — 0.25 ATR
🔹 Departure requirement — 0.75 ATR
🔹 Response window — 5 bars
🔹 Retest window — 15 bars
🔹 Entry confirmation window — 3 subsequent bars
🔹 Trend EMA — 50
🔹 Stop buffer — 0.30 ATR
🔹 Tracking expiry — 100 subsequent bars
🔹 Cooldown — 5 complete bars
Choose Both, Rebound or Retest signal types.
Alerts are available for BUY, SELL, Rebound, Retest and tracking completion. Use “Once Per Bar Close” and recreate alerts after changing code or inputs.
⏺️ การตั้งค่าและ Alert
ค่าเริ่มต้นสำคัญ:
🔹 Pivot ซ้าย/ขวา — 3 / 3 แท่ง
🔹 เก็บโซน — 12 โซน
🔹 อายุโซน — 300 แท่งนับจากสร้าง
🔹 ATR / RSI — 14 / 14
🔹 ครึ่งความกว้างโซน — 0.25 ATR
🔹 ระยะออกห่างก่อนทดสอบใหม่ — 0.75 ATR
🔹 ช่วงวัดการตอบสนอง — 5 แท่ง
🔹 เวลารอ Retest — 15 แท่ง
🔹 เวลารอยืนยันเข้า — 3 แท่งถัดไป
🔹 Trend EMA — 50
🔹 ระยะเพิ่ม Stop — 0.30 ATR
🔹 หมดระยะติดตาม — 100 แท่งถัดไป
🔹 เว้นระยะหลังจบรอบ — 5 แท่งเต็ม
เลือกสัญญาณได้ทั้งสองรูปแบบ หรือเฉพาะ Rebound / Retest
มี Alert สำหรับ BUY, SELL, Rebound, Retest และสิ้นสุดการติดตาม ตั้ง Once Per Bar Close และสร้างใหม่หลังเปลี่ยนโค้ดหรือ Input
⏺️ Development and references
This Pine Script v6 implementation was written for this development without copying Community script source code.
It extends established support/resistance methods with test-cycle counting, completed response measurements, frozen setup references, opposing-zone room checks and single-signal tracking.
The underlying concepts are established methods. No claim is made that this combination is globally unique.
References:
🔹 J. Welles Wilder Jr. — New Concepts in Technical Trading Systems (1978): ATR and RSI
🔹 Confirmed swing pivots and support/resistance role reversal — standard technical-analysis concepts
TradingView — Average True Range
TradingView — Relative Strength Index
TradingView — Repainting and pivot timing
⏺️ การพัฒนาและอ้างอิง
เขียนด้วย Pine Script v6 สำหรับการพัฒนานี้ โดยไม่คัดลอกโค้ดจากสคริปต์ Community
ต่อยอดแนวรับ–แนวต้านด้วยการนับรอบทดสอบ การวัดการตอบสนองที่ครบช่วงแล้ว การตรึงจังหวะรอยืนยัน การตรวจพื้นที่ถึงโซนตรงข้าม และการติดตามครั้งละหนึ่งสัญญาณ
หลักการพื้นฐานมีอยู่เดิม ไม่อ้างว่าแนวคิดผสมนี้ไม่เคยมีผู้ทำมาก่อนทั้งหมด
⏺️ Limitations and disclaimer
🔹 Use standard price charts.
🔹 Pivot confirmation introduces a deliberate delay.
🔹 All windows are bar-based; changing timeframe changes their elapsed duration.
🔹 Overlapping zones can produce different interpretations. Response statistics do not determine signal eligibility or rank zone reliability in this version.
🔹 No TFEX-specific session filter or contract-roll adjustment is included.
🔹 Level touches do not account for fills, gaps, fees, slippage or liquidity.
🔹 No win rate or profitability has been established.
🔹 Static checks and basic numerical scenarios were completed; TradingView compilation and market-data validation remain pending.
🔹 For educational and informational purposes only. This indicator does not constitute personalized investment advice or guarantee returns.
⏺️ ข้อจำกัดและคำชี้แจง
🔹 ใช้กับกราฟราคามาตรฐาน
🔹 Pivot ต้องรอการยืนยัน จึงมีความล่าช้าตามจำนวนแท่งที่เลือก
🔹 ทุกช่วงนับเป็นแท่ง ระยะเวลาจริงเปลี่ยนเมื่อเปลี่ยน Timeframe
🔹 โซนซ้อนทับอาจตีความต่างกัน ในเวอร์ชันนี้สถิติการตอบสนองใช้แสดงข้อมูล ยังไม่ได้ใช้คัดสัญญาณหรือจัดอันดับความน่าเชื่อถือของโซน
🔹 ยังไม่มีตัวกรอง Session เฉพาะ TFEX หรือการปรับผลจากการเปลี่ยนสัญญา
🔹 การแตะระดับไม่ได้รวมราคาจับคู่จริง Gap ค่าธรรมเนียม Slippage หรือสภาพคล่อง
🔹 ยังไม่มีผลยืนยัน Win Rate หรือความสามารถในการทำกำไร
🔹 ตรวจโครงสร้างและสถานการณ์เชิงตัวเลขเบื้องต้นแล้ว แต่ยังไม่ได้ compile ใน TradingView หรือทดสอบข้อมูลตลาดจริง
🔹 ใช้เพื่อการศึกษาและประกอบการวิเคราะห์ ไม่ใช่คำแนะนำลงทุนเฉพาะบุคคลหรือการรับประกันผลตอบแทน
Convert to PDF
⋮⋮⋮⋮⋮⋮⋮⋮
Open-source Skript
Ganz im Sinne von TradingView hat dieser Autor sein/ihr Script als Open-Source veröffentlicht. Auf diese Weise können nun auch andere Trader das Script rezensieren und die Funktionalität überprüfen. Vielen Dank an den Autor! Sie können das Script kostenlos verwenden, aber eine Wiederveröffentlichung des Codes unterliegt unseren Hausregeln.

Haftungsausschluss
Die Informationen und Veröffentlichungen sind nicht als Finanz-, Anlage-, Handels- oder andere Arten von Ratschlägen oder Empfehlungen gedacht, die von TradingView bereitgestellt oder gebilligt werden, und stellen diese nicht dar. Lesen Sie mehr in den Nutzungsbedingungen.
Open-source Skript
Ganz im Sinne von TradingView hat dieser Autor sein/ihr Script als Open-Source veröffentlicht. Auf diese Weise können nun auch andere Trader das Script rezensieren und die Funktionalität überprüfen. Vielen Dank an den Autor! Sie können das Script kostenlos verwenden, aber eine Wiederveröffentlichung des Codes unterliegt unseren Hausregeln.
Haftungsausschluss
Die Informationen und Veröffentlichungen sind nicht als Finanz-, Anlage-, Handels- oder andere Arten von Ratschlägen oder Empfehlungen gedacht, die von TradingView bereitgestellt oder gebilligt werden, und stellen diese nicht dar. Lesen Sie mehr in den Nutzungsbedingungen.