OPEN-SOURCE SCRIPT
Post-Earnings Return Dashboard
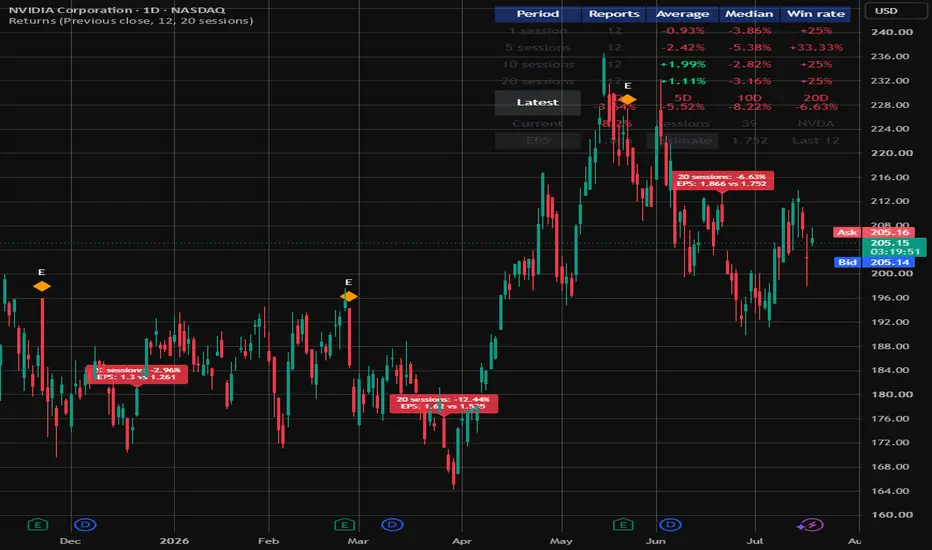
Post-Earnings Return Dashboard
Post-Earnings Return Dashboard is designed to show how a stock has historically performed after earnings reports.
The script automatically detects earnings events using TradingView’s built-in earnings data, calculates post-earnings returns over several periods, and displays the results in an on-chart dashboard.
What the indicator measures
For each detected earnings report, the indicator calculates the stock’s return after:
1 trading session
5 trading sessions
10 trading sessions
20 trading sessions
The return is calculated using:
Return = Future closing price divided by the selected reference price, minus 1, multiplied by 100.
Dashboard statistics
For each return period, the dashboard displays:
Reports — the number of completed earnings observations included in the calculation
Average — the average return across the selected earnings history
Median — the middle result when all returns are arranged from lowest to highest
Win rate — the percentage of earnings events that produced a positive return
A return of exactly 0% is not counted as a win.
The number of observations may differ between periods because the latest earnings report may not yet have completed the 10-session or 20-session measurement window.
Latest row
The Latest row shows the completed returns following the most recently detected earnings report.
1D — return after 1 trading session
5D — return after 5 trading sessions
10D — return after 10 trading sessions
20D — return after 20 trading sessions
Once a measurement period has completed, its value is stored and does not continue changing.
If the latest earnings event occurred fewer than 20 sessions ago, some longer-period values may remain blank.
Current row
The Current row shows the live return from the latest earnings reference price to the current closing price.
It also displays:
Sessions — the number of trading sessions since the latest detected earnings report
Ticker — the symbol currently displayed on the chart
For example, Current -4.42%, Sessions 17, TSM means the stock is currently trading 4.42% below its selected earnings reference price, 17 trading sessions after the latest report.
EPS row
The bottom row displays information about the latest detected earnings event.
EPS — the reported earnings per share
Estimate — the analyst EPS estimate
Last X — the maximum number of recent earnings reports included in the historical statistics
For example, EPS 4.221, Estimate 3.81, Last 12 means the company reported EPS of 4.221 against an estimate of 3.81, while the dashboard is configured to use up to the latest 12 earnings reports.
Return starting price
The indicator provides two reference-price options.
Previous close
Uses the closing price immediately before the earnings bar.
This is generally the most consistent option for measuring the full market reaction when the exact earnings-release timing is unknown.
Earnings-bar close
Uses the closing price of the bar on which TradingView registers the earnings event.
This may be more appropriate when the report is known to have been released after that trading session closed.
Historical sample size
Users can choose how many recent earnings reports are included in the statistics.
For a company reporting quarterly:
4 reports is approximately 1 year
8 reports is approximately 2 years
12 reports is approximately 3 years
20 reports is approximately 5 years
A smaller sample may better reflect recent behaviour, while a larger sample may provide a broader long-term view.
Chart markers and labels
The indicator can optionally:
Mark earnings dates with an E symbol
Display historical post-earnings return labels
Show the selected 1, 5, 10, or 20-session return directly on the chart
Display reported and estimated EPS where available
These options can be disabled to keep the chart clean.
Recommended timeframe
This indicator is designed for use on the daily chart.
The script counts chart bars as trading sessions.
On a daily chart:
1 bar equals 1 trading session
5 bars is approximately 1 trading week
20 bars is approximately 1 trading month
Using the indicator on an intraday chart will cause it to count intraday candles rather than trading days, which will produce misleading results.
How to interpret the statistics
The statistics should be considered together rather than individually.
A positive average, positive median, and high win rate may indicate historically consistent post-earnings strength.
A positive average with a negative median may mean that a small number of large gains are distorting the average.
A high win rate with a low average may indicate frequent small gains but occasional large losses.
A low win rate with a positive average may indicate less frequent but much larger winning reactions.
A negative average and negative median may indicate persistent post-earnings weakness over the selected sample.
Potential uses
This indicator may be useful for:
Reviewing a stock before an upcoming earnings report
Studying post-earnings announcement drift
Comparing the latest earnings reaction with previous reports
Assessing whether earnings gaps tend to continue or reverse
Identifying stocks with historically consistent earnings reactions
Supporting swing-trade research
Comparing post-earnings behaviour across different stocks
Evaluating whether holding after earnings has historically been favourable
Data source
The script retrieves earnings information through TradingView’s built-in request.earnings function.
It uses:
Reported EPS
Estimated EPS
The earnings event bar supplied by TradingView
The indicator does not scrape company filings or external websites.
Results depend on the earnings and price history available for the selected symbol on TradingView.
Limitations
TradingView does not consistently expose the precise release time for every earnings report.
The script may therefore be unable to determine whether an individual report was released before market open, during the trading session, or after market close.
This can affect which closing price most accurately represents the price immediately before the market received the information.
The indicator measures raw stock returns and does not currently adjust for overall market performance, sector performance, index movement, dividends, currency changes, volatility, earnings gap size, revenue surprises, or forward guidance.
A positive return does not necessarily mean the stock outperformed the wider market.
Post-Earnings Return Dashboard is designed to show how a stock has historically performed after earnings reports.
The script automatically detects earnings events using TradingView’s built-in earnings data, calculates post-earnings returns over several periods, and displays the results in an on-chart dashboard.
What the indicator measures
For each detected earnings report, the indicator calculates the stock’s return after:
1 trading session
5 trading sessions
10 trading sessions
20 trading sessions
The return is calculated using:
Return = Future closing price divided by the selected reference price, minus 1, multiplied by 100.
Dashboard statistics
For each return period, the dashboard displays:
Reports — the number of completed earnings observations included in the calculation
Average — the average return across the selected earnings history
Median — the middle result when all returns are arranged from lowest to highest
Win rate — the percentage of earnings events that produced a positive return
A return of exactly 0% is not counted as a win.
The number of observations may differ between periods because the latest earnings report may not yet have completed the 10-session or 20-session measurement window.
Latest row
The Latest row shows the completed returns following the most recently detected earnings report.
1D — return after 1 trading session
5D — return after 5 trading sessions
10D — return after 10 trading sessions
20D — return after 20 trading sessions
Once a measurement period has completed, its value is stored and does not continue changing.
If the latest earnings event occurred fewer than 20 sessions ago, some longer-period values may remain blank.
Current row
The Current row shows the live return from the latest earnings reference price to the current closing price.
It also displays:
Sessions — the number of trading sessions since the latest detected earnings report
Ticker — the symbol currently displayed on the chart
For example, Current -4.42%, Sessions 17, TSM means the stock is currently trading 4.42% below its selected earnings reference price, 17 trading sessions after the latest report.
EPS row
The bottom row displays information about the latest detected earnings event.
EPS — the reported earnings per share
Estimate — the analyst EPS estimate
Last X — the maximum number of recent earnings reports included in the historical statistics
For example, EPS 4.221, Estimate 3.81, Last 12 means the company reported EPS of 4.221 against an estimate of 3.81, while the dashboard is configured to use up to the latest 12 earnings reports.
Return starting price
The indicator provides two reference-price options.
Previous close
Uses the closing price immediately before the earnings bar.
This is generally the most consistent option for measuring the full market reaction when the exact earnings-release timing is unknown.
Earnings-bar close
Uses the closing price of the bar on which TradingView registers the earnings event.
This may be more appropriate when the report is known to have been released after that trading session closed.
Historical sample size
Users can choose how many recent earnings reports are included in the statistics.
For a company reporting quarterly:
4 reports is approximately 1 year
8 reports is approximately 2 years
12 reports is approximately 3 years
20 reports is approximately 5 years
A smaller sample may better reflect recent behaviour, while a larger sample may provide a broader long-term view.
Chart markers and labels
The indicator can optionally:
Mark earnings dates with an E symbol
Display historical post-earnings return labels
Show the selected 1, 5, 10, or 20-session return directly on the chart
Display reported and estimated EPS where available
These options can be disabled to keep the chart clean.
Recommended timeframe
This indicator is designed for use on the daily chart.
The script counts chart bars as trading sessions.
On a daily chart:
1 bar equals 1 trading session
5 bars is approximately 1 trading week
20 bars is approximately 1 trading month
Using the indicator on an intraday chart will cause it to count intraday candles rather than trading days, which will produce misleading results.
How to interpret the statistics
The statistics should be considered together rather than individually.
A positive average, positive median, and high win rate may indicate historically consistent post-earnings strength.
A positive average with a negative median may mean that a small number of large gains are distorting the average.
A high win rate with a low average may indicate frequent small gains but occasional large losses.
A low win rate with a positive average may indicate less frequent but much larger winning reactions.
A negative average and negative median may indicate persistent post-earnings weakness over the selected sample.
Potential uses
This indicator may be useful for:
Reviewing a stock before an upcoming earnings report
Studying post-earnings announcement drift
Comparing the latest earnings reaction with previous reports
Assessing whether earnings gaps tend to continue or reverse
Identifying stocks with historically consistent earnings reactions
Supporting swing-trade research
Comparing post-earnings behaviour across different stocks
Evaluating whether holding after earnings has historically been favourable
Data source
The script retrieves earnings information through TradingView’s built-in request.earnings function.
It uses:
Reported EPS
Estimated EPS
The earnings event bar supplied by TradingView
The indicator does not scrape company filings or external websites.
Results depend on the earnings and price history available for the selected symbol on TradingView.
Limitations
TradingView does not consistently expose the precise release time for every earnings report.
The script may therefore be unable to determine whether an individual report was released before market open, during the trading session, or after market close.
This can affect which closing price most accurately represents the price immediately before the market received the information.
The indicator measures raw stock returns and does not currently adjust for overall market performance, sector performance, index movement, dividends, currency changes, volatility, earnings gap size, revenue surprises, or forward guidance.
A positive return does not necessarily mean the stock outperformed the wider market.
Open-source Skript
Ganz im Sinne von TradingView hat dieser Autor sein/ihr Script als Open-Source veröffentlicht. Auf diese Weise können nun auch andere Trader das Script rezensieren und die Funktionalität überprüfen. Vielen Dank an den Autor! Sie können das Script kostenlos verwenden, aber eine Wiederveröffentlichung des Codes unterliegt unseren Hausregeln.

Haftungsausschluss
Die Informationen und Veröffentlichungen sind nicht als Finanz-, Anlage-, Handels- oder andere Arten von Ratschlägen oder Empfehlungen gedacht, die von TradingView bereitgestellt oder gebilligt werden, und stellen diese nicht dar. Lesen Sie mehr in den Nutzungsbedingungen.
Open-source Skript
Ganz im Sinne von TradingView hat dieser Autor sein/ihr Script als Open-Source veröffentlicht. Auf diese Weise können nun auch andere Trader das Script rezensieren und die Funktionalität überprüfen. Vielen Dank an den Autor! Sie können das Script kostenlos verwenden, aber eine Wiederveröffentlichung des Codes unterliegt unseren Hausregeln.
Haftungsausschluss
Die Informationen und Veröffentlichungen sind nicht als Finanz-, Anlage-, Handels- oder andere Arten von Ratschlägen oder Empfehlungen gedacht, die von TradingView bereitgestellt oder gebilligt werden, und stellen diese nicht dar. Lesen Sie mehr in den Nutzungsbedingungen.