Gunjan Algo Auto Buy/Sell
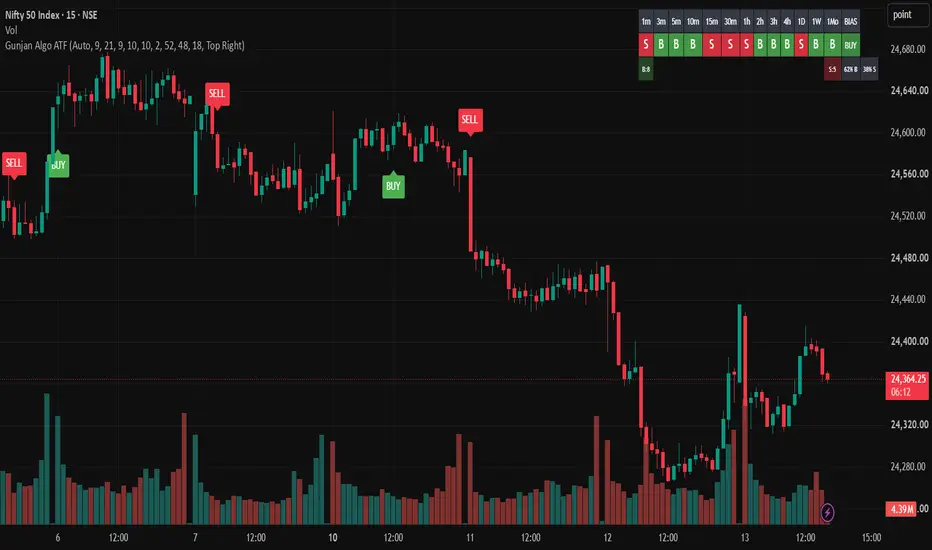
# Gunjan Algo Edge All TF
Gunjan Algo Edge All TF is a multi-timeframe adaptive technical-analysis indicator designed to help traders evaluate trend direction, momentum, price structure, and market alignment from a single chart.
Instead of relying on one indicator or one fixed parameter set across every timeframe, the script automatically adapts its core calculation parameters to the active chart timeframe. It supports short-term intraday analysis through higher-timeframe market context, with an integrated MTF dashboard covering 1m, 3m, 5m, 10m, 15m, 30m, 1h, 2h, 3h, 4h, 1D, 1W and 1Mo.
The indicator is intended as a decision-support and market-structure tool. It does not guarantee profitable trades and should not be interpreted as financial or investment advice.
## What makes the indicator different?
The main objective of Gunjan Algo Edge All TF is to combine several independent technical conditions into a structured signal framework rather than generating a signal from a single crossover.
The signal engine evaluates:
* Fast and slow EMA relationship
* EMA direction and momentum
* EMA separation
* RSI momentum
* DMI directional pressure
* ADX trend-quality filter
* VWAP price bias
* Recent price-structure breaks
* Reversal momentum
* Candle quality
* Adaptive noise filtering
* Multi-timeframe signal alignment
The script can operate in three modes:
1. Auto
2. Original 5M
3. Manual
In Auto mode, the indicator changes its calculation parameters according to the active timeframe. The source code contains separate parameter profiles for short-term and higher-timeframe analysis.
## Adaptive timeframe engine
The Auto mode is designed to avoid using exactly the same sensitivity on every timeframe.
For example, the default Auto profiles include:
| Timeframe | Fast EMA | Slow EMA | RSI | DI | ADX Minimum |
| --------- | -------: | -------: | --: | -: | ----------: |
| 1m | 6 | 13 | 7 | 7 | 21.0 |
| 3m | 8 | 18 | 8 | 9 | 19.5 |
| 5m | 9 | 21 | 9 | 10 | 18.0 |
| 10m | 10 | 24 | 10 | 10 | 18.0 |
| 15m | 12 | 27 | 10 | 11 | 18.0 |
| 30m | 15 | 34 | 11 | 12 | 18.0 |
| 1h | 18 | 40 | 12 | 13 | 18.0 |
| 2h | 21 | 45 | 13 | 13 | 18.5 |
| 3h | 23 | 48 | 14 | 14 | 18.5 |
| 4h | 24 | 50 | 14 | 14 | 19.0 |
| Higher TF | 30 | 60 | 14 | 14 | 20.0 |
These profiles are part of the indicator's adaptive design and are not presented as universally optimal settings.
## Core signal architecture
### 1. EMA momentum
The bullish EMA condition requires the fast EMA to be above the slow EMA and rising.
The bearish condition requires the fast EMA to be below the slow EMA and falling.
This gives the signal engine both directional and momentum information rather than using an EMA crossover alone.
### 2. EMA separation filter
The indicator measures the percentage distance between the fast and slow EMA.
The purpose is to reduce signals when the two averages are excessively compressed and the market may be lacking directional separation.
The separation requirement itself adapts according to timeframe. The 5-minute profile, for example, does not require the same separation threshold used on several other timeframes.
### 3. RSI momentum
The BUY side requires RSI to be above the configured BUY threshold and rising.
The SELL side requires RSI to be below the configured SELL threshold and falling.
The default thresholds are:
* BUY RSI: 52
* SELL RSI: 48
These are momentum thresholds rather than traditional overbought/oversold levels.
### 4. DMI directional pressure
The indicator compares +DI and -DI.
* +DI > -DI supports bullish conditions.
* -DI > +DI supports bearish conditions.
This provides directional confirmation to the trend and momentum calculations.
### 5. ADX trend-quality filter
ADX is used as a minimum trend-quality filter.
A signal is permitted only when ADX reaches the adaptive minimum for the selected timeframe.
This is intended to reduce signals during conditions where directional movement may be too weak.
### 6. VWAP bias
The indicator uses VWAP as another contextual filter.
Bullish conditions favor price trading above VWAP or demonstrating bullish price/EMA behavior.
Bearish conditions favor price trading below VWAP or demonstrating bearish price/EMA behavior.
VWAP therefore acts as a contextual market-bias component rather than being used as a standalone entry trigger.
### 7. Price structure
The indicator evaluates the recent high and low over its adaptive structure lookback.
A bullish structure condition occurs when the confirmed closing price breaks above the recent high.
A bearish structure condition occurs when the confirmed closing price breaks below the recent low.
### 8. Reversal momentum
The script also has a second signal route designed to identify developing directional changes.
It monitors:
* RSI crossing its configured threshold
* DMI directional crossover
* Price position relative to the fast EMA
* Directional DMI confirmation
* RSI position relative to 50
This creates a second route for signals when momentum changes before a conventional structure-break setup becomes available.
## BUY signal logic
The BUY engine has two principal routes.
### Route 1 — Trend/structure confirmation
A BUY setup can develop when:
* Recent structure breaks upward
* EMA momentum is bullish
* RSI momentum is bullish
* DMI is bullish
The broader signal then additionally requires trend quality, VWAP confirmation, candle quality, EMA separation and noise filtering.
### Route 2 — Reversal/momentum confirmation
A BUY setup can also develop when:
* RSI or DMI shows a bullish reversal event
* Price is above the fast EMA
* DMI confirms bullish direction
* RSI is above 50
Again, the broader filters must agree before the final BUY signal is produced.
The actual source code combines these routes with trend-quality, VWAP, candle, EMA-separation and noise conditions.
## SELL signal logic
The SELL engine mirrors the BUY framework.
### Route 1 — Trend/structure confirmation
A SELL setup can develop when:
* Recent structure breaks downward
* EMA momentum is bearish
* RSI momentum is bearish
* DMI is bearish
### Route 2 — Reversal/momentum confirmation
A SELL setup can develop when:
* RSI or DMI produces a bearish reversal event
* Price is below the fast EMA
* DMI confirms bearish direction
* RSI is below 50
The broader SELL filters must also agree before the final signal is displayed.
## Signal confirmation
Signals are generated only on confirmed bars.
The script also maintains a signal state so that it does not continuously print the same BUY or SELL label on every qualifying candle.
The chart therefore focuses on directional transitions rather than repeatedly printing identical labels.
## How to read the chart
The indicator displays:
* Green BUY label = bullish signal
* Red SELL label = bearish signal
The chart labels are deliberately simple so that the underlying price action remains visible.
### Example 1 — Bullish trend continuation
Imagine the following sequence on a 5-minute chart:
1. Price is trading above VWAP.
2. Fast EMA is above slow EMA and rising.
3. RSI moves above the BUY threshold and continues rising.
4. +DI moves above -DI.
5. ADX is above the required minimum.
6. Price breaks the recent structure high.
7. A bullish candle closes with sufficient strength.
If the remaining filters agree, the indicator can print:
BUY
This should be interpreted as a bullish technical alignment, not as a guarantee that price will continue higher.
### Example 2 — Bearish trend continuation
Imagine the opposite sequence:
1. Price trades below VWAP.
2. Fast EMA is below slow EMA and falling.
3. RSI moves below the SELL threshold.
4. -DI exceeds +DI.
5. ADX satisfies the timeframe requirement.
6. Price breaks recent structure support.
7. A bearish candle closes with sufficient strength.
The indicator can then print:
SELL
Again, the signal represents technical conditions detected by the indicator and not a guaranteed future outcome.
### Example 3 — Reversal setup
Suppose price has been declining but momentum begins to change.
RSI crosses upward through its BUY threshold, +DI crosses above -DI, price moves above the fast EMA, and RSI moves above 50.
If the trend-quality, VWAP, candle, separation and noise filters also agree, the reversal route can generate a BUY signal.
The same concept applies in reverse for bearish reversals.
## Multi-timeframe dashboard
One of the main features of Gunjan Algo Edge All TF is its MTF dashboard.
The dashboard evaluates the indicator's signal framework across:
1m | 3m | 5m | 10m | 15m | 30m | 1h | 2h | 3h | 4h | 1D | 1W | 1Mo
The dashboard uses:
* B = BUY
* S = SELL
* — = NO SIGNAL
It also calculates an overall directional bias from the active timeframe signals.
### Dashboard example
A hypothetical dashboard could look like:
| 1m | 3m | 5m | 10m | 15m | 30m | 1h | 2h | 4h | 1D | Bias |
| -- | -- | -- | --- | --- | --- | -- | -- | -- | -- | ---- |
| B | B | B | B | B | B | B | — | B | B | BUY |
In this example, the lower and higher timeframes are generally aligned bullishly.
A different example:
| 1m | 3m | 5m | 10m | 15m | 30m | 1h | 2h | 4h | 1D | Bias |
| -- | -- | -- | --- | --- | --- | -- | -- | -- | -- | ----- |
| S | B | S | — | B | — | B | B | S | B | MIXED |
This indicates conflicting timeframe information.
A MIXED condition should generally be treated as a warning that the market does not have strong multi-timeframe agreement.
## Overall bias
The dashboard calculates the proportion of active BUY and SELL signals across its monitored timeframes.
The displayed bias is classified as:
* STRONG BUY
* BUY
* MIXED
* SELL
* STRONG SELL
* NO SIGNAL
The current implementation uses an 80% threshold for STRONG BUY/STRONG SELL and a 60% threshold for BUY/SELL.
The overall bias is a summary of the indicator's multi-timeframe technical state. It is not a prediction of future price.
## Suggested workflow
### Intraday traders
A practical workflow can be:
1. Start with the higher timeframes.
2. Check whether the 1h, 2h, 4h and daily signals generally agree.
3. Move to the intended execution timeframe.
4. Wait for the chart's BUY or SELL signal.
5. Check price structure and market context.
6. Define the trade's invalidation level before entering.
7. Determine position size according to your own risk rules.
8. Use the MTF dashboard as confirmation rather than treating it as an automatic trade command.
### Scalping
For short-term trading, the 1m, 3m and 5m columns can provide faster information, but lower timeframes generally contain more market noise.
Do not assume that a lower-timeframe signal is automatically superior to a higher-timeframe signal.
### Swing analysis
For higher-timeframe analysis, the 4h, daily, weekly and monthly readings can provide broader directional context.
A trader may use the higher timeframe for market bias and a lower timeframe for execution.
## Example decision framework
### Stronger bullish alignment
Higher timeframe: BUY
Execution timeframe: BUY
Lower timeframe: BUY
Price structure: bullish
VWAP context: bullish
Possible interpretation:
"Multiple technical components are aligned bullishly."
This is still not a guarantee of a profitable trade.
### Conflicting alignment
Higher timeframe: SELL
Execution timeframe: BUY
Lower timeframe: BUY
Possible interpretation:
"Short-term momentum is bullish while the broader trend remains bearish."
A trader may choose to wait for greater alignment rather than acting immediately.
## Settings
### Mode
**Auto**
Automatically selects the timeframe-specific parameter profile.
**Original 5M**
Uses the original 5-minute parameter configuration.
**Manual**
Allows the user to specify:
* Fast EMA
* Slow EMA
* RSI length
* DI length
* ADX smoothing
* Structure lookback
* Minimum ADX
The script exposes these controls directly in its settings.
### Adaptive Noise Filter
When enabled, the indicator applies additional directional conditions intended to reduce signals during less favorable price/EMA configurations.
### EMA Separation Filter
When enabled, the indicator requires the EMA relationship to satisfy the timeframe-specific separation condition.
### MTF Dashboard
The dashboard can be enabled/disabled and positioned at:
* Top Right
* Top Left
* Bottom Right
* Bottom Left
The overall bias display can also be enabled or disabled.
## Alerts
The indicator includes alert conditions for BUY and SELL signals.
Users can create TradingView alerts from these conditions and choose their preferred notification method.
Always verify the alert configuration and the selected symbol/timeframe before relying on alerts for live monitoring.
## Repainting and data handling
The MTF calculations use `request.security()` with `lookahead=barmerge.lookahead_off`, which avoids intentionally requesting future values from higher/lower timeframe calculations.
Signals on the current chart are additionally restricted to confirmed bars.
However, traders should understand that any real-time technical indicator can change its developing conditions while the current candle is still forming. For this reason, the published indicator is intended to be interpreted using confirmed signals rather than assuming that an intrabar condition is permanent.
## Recommended chart setup
For a clean TradingView publication:
* Use a standard candlestick chart.
* Keep the Gunjan Algo Edge All TF indicator clearly visible.
* Avoid unnecessary additional indicators on the publication screenshot.
* Show the complete symbol and timeframe.
* Make the BUY/SELL labels clearly visible.
* Keep the MTF dashboard readable.
* Use a chart section where the relationship between price action, signals and dashboard can be understood.
TradingView specifically recommends clean publication charts where the script's output is easy to identify.
## Important limitations
Gunjan Algo Edge All TF is a technical-analysis tool.
It does not:
* Predict the future with certainty.
* Guarantee profitable trades.
* Guarantee a particular win rate.
* Guarantee a particular risk/reward ratio.
* Eliminate losing trades.
* Replace risk management.
* Replace market or instrument-specific analysis.
* Guarantee that every BUY signal will result in a bullish move.
* Guarantee that every SELL signal will result in a bearish move.
Market conditions can change rapidly, and technical signals can fail during news events, volatility shocks, gaps, illiquid periods, sideways markets and other abnormal conditions.
The indicator should therefore be used as one component of a broader trading process.
## Risk management
Before taking any trade, consider:
* Entry price
* Invalidation level
* Stop-loss placement
* Position size
* Maximum acceptable loss
* Transaction costs
* Slippage
* Market liquidity
* Trading-session conditions
* Higher-timeframe context
Never risk capital that you cannot afford to lose.
## House Rules and publication compliance
This publication is written to provide a clear explanation of the indicator's purpose, methodology and usage without making unsupported performance claims.
The description intentionally does not claim a guaranteed win rate, guaranteed profitability, guaranteed accuracy or future performance.
TradingView's Script Publishing Rules require descriptions to explain what a script does, how it works and how traders can use it, while also prohibiting unrealistic or unsubstantiated performance claims.
The indicator should also be published with an original, clean chart and without misleading visual demonstrations. TradingView's House Rules prohibit plagiarism and require published content to be understandable and appropriately described.
If the script contains reused open-source code from another TradingView author, the appropriate author credit and reuse requirements must be satisfied before public publication. TradingView specifically requires attribution and additional conditions when qualifying open-source code is reused.
## Financial disclaimer
This indicator is provided for informational and educational purposes only.
Nothing in this indicator or its description constitutes investment advice, financial advice, a recommendation to buy or sell any security, derivative, cryptocurrency, commodity or other financial instrument, or a guarantee of future results.
Trading involves substantial risk. Past performance or historical behavior does not guarantee future results.
Users are responsible for their own trading decisions, risk management, due diligence and compliance with applicable laws and regulations.
## Final note
Gunjan Algo Edge All TF is best viewed as a structured market-analysis framework.
The goal is not to make every candle produce a signal. The system intentionally combines trend, momentum, structure, volatility/trend quality and multi-timeframe information so that traders can distinguish between directional alignment and conflicting market conditions.
Use the BUY and SELL labels as technical events, use the MTF dashboard as context, and combine the indicator with disciplined risk management and independent analysis.
Gunjan Algo Edge All TF is a multi-timeframe adaptive technical-analysis indicator designed to help traders evaluate trend direction, momentum, price structure, and market alignment from a single chart.
Instead of relying on one indicator or one fixed parameter set across every timeframe, the script automatically adapts its core calculation parameters to the active chart timeframe. It supports short-term intraday analysis through higher-timeframe market context, with an integrated MTF dashboard covering 1m, 3m, 5m, 10m, 15m, 30m, 1h, 2h, 3h, 4h, 1D, 1W and 1Mo.
The indicator is intended as a decision-support and market-structure tool. It does not guarantee profitable trades and should not be interpreted as financial or investment advice.
## What makes the indicator different?
The main objective of Gunjan Algo Edge All TF is to combine several independent technical conditions into a structured signal framework rather than generating a signal from a single crossover.
The signal engine evaluates:
* Fast and slow EMA relationship
* EMA direction and momentum
* EMA separation
* RSI momentum
* DMI directional pressure
* ADX trend-quality filter
* VWAP price bias
* Recent price-structure breaks
* Reversal momentum
* Candle quality
* Adaptive noise filtering
* Multi-timeframe signal alignment
The script can operate in three modes:
1. Auto
2. Original 5M
3. Manual
In Auto mode, the indicator changes its calculation parameters according to the active timeframe. The source code contains separate parameter profiles for short-term and higher-timeframe analysis.
## Adaptive timeframe engine
The Auto mode is designed to avoid using exactly the same sensitivity on every timeframe.
For example, the default Auto profiles include:
| Timeframe | Fast EMA | Slow EMA | RSI | DI | ADX Minimum |
| --------- | -------: | -------: | --: | -: | ----------: |
| 1m | 6 | 13 | 7 | 7 | 21.0 |
| 3m | 8 | 18 | 8 | 9 | 19.5 |
| 5m | 9 | 21 | 9 | 10 | 18.0 |
| 10m | 10 | 24 | 10 | 10 | 18.0 |
| 15m | 12 | 27 | 10 | 11 | 18.0 |
| 30m | 15 | 34 | 11 | 12 | 18.0 |
| 1h | 18 | 40 | 12 | 13 | 18.0 |
| 2h | 21 | 45 | 13 | 13 | 18.5 |
| 3h | 23 | 48 | 14 | 14 | 18.5 |
| 4h | 24 | 50 | 14 | 14 | 19.0 |
| Higher TF | 30 | 60 | 14 | 14 | 20.0 |
These profiles are part of the indicator's adaptive design and are not presented as universally optimal settings.
## Core signal architecture
### 1. EMA momentum
The bullish EMA condition requires the fast EMA to be above the slow EMA and rising.
The bearish condition requires the fast EMA to be below the slow EMA and falling.
This gives the signal engine both directional and momentum information rather than using an EMA crossover alone.
### 2. EMA separation filter
The indicator measures the percentage distance between the fast and slow EMA.
The purpose is to reduce signals when the two averages are excessively compressed and the market may be lacking directional separation.
The separation requirement itself adapts according to timeframe. The 5-minute profile, for example, does not require the same separation threshold used on several other timeframes.
### 3. RSI momentum
The BUY side requires RSI to be above the configured BUY threshold and rising.
The SELL side requires RSI to be below the configured SELL threshold and falling.
The default thresholds are:
* BUY RSI: 52
* SELL RSI: 48
These are momentum thresholds rather than traditional overbought/oversold levels.
### 4. DMI directional pressure
The indicator compares +DI and -DI.
* +DI > -DI supports bullish conditions.
* -DI > +DI supports bearish conditions.
This provides directional confirmation to the trend and momentum calculations.
### 5. ADX trend-quality filter
ADX is used as a minimum trend-quality filter.
A signal is permitted only when ADX reaches the adaptive minimum for the selected timeframe.
This is intended to reduce signals during conditions where directional movement may be too weak.
### 6. VWAP bias
The indicator uses VWAP as another contextual filter.
Bullish conditions favor price trading above VWAP or demonstrating bullish price/EMA behavior.
Bearish conditions favor price trading below VWAP or demonstrating bearish price/EMA behavior.
VWAP therefore acts as a contextual market-bias component rather than being used as a standalone entry trigger.
### 7. Price structure
The indicator evaluates the recent high and low over its adaptive structure lookback.
A bullish structure condition occurs when the confirmed closing price breaks above the recent high.
A bearish structure condition occurs when the confirmed closing price breaks below the recent low.
### 8. Reversal momentum
The script also has a second signal route designed to identify developing directional changes.
It monitors:
* RSI crossing its configured threshold
* DMI directional crossover
* Price position relative to the fast EMA
* Directional DMI confirmation
* RSI position relative to 50
This creates a second route for signals when momentum changes before a conventional structure-break setup becomes available.
## BUY signal logic
The BUY engine has two principal routes.
### Route 1 — Trend/structure confirmation
A BUY setup can develop when:
* Recent structure breaks upward
* EMA momentum is bullish
* RSI momentum is bullish
* DMI is bullish
The broader signal then additionally requires trend quality, VWAP confirmation, candle quality, EMA separation and noise filtering.
### Route 2 — Reversal/momentum confirmation
A BUY setup can also develop when:
* RSI or DMI shows a bullish reversal event
* Price is above the fast EMA
* DMI confirms bullish direction
* RSI is above 50
Again, the broader filters must agree before the final BUY signal is produced.
The actual source code combines these routes with trend-quality, VWAP, candle, EMA-separation and noise conditions.
## SELL signal logic
The SELL engine mirrors the BUY framework.
### Route 1 — Trend/structure confirmation
A SELL setup can develop when:
* Recent structure breaks downward
* EMA momentum is bearish
* RSI momentum is bearish
* DMI is bearish
### Route 2 — Reversal/momentum confirmation
A SELL setup can develop when:
* RSI or DMI produces a bearish reversal event
* Price is below the fast EMA
* DMI confirms bearish direction
* RSI is below 50
The broader SELL filters must also agree before the final signal is displayed.
## Signal confirmation
Signals are generated only on confirmed bars.
The script also maintains a signal state so that it does not continuously print the same BUY or SELL label on every qualifying candle.
The chart therefore focuses on directional transitions rather than repeatedly printing identical labels.
## How to read the chart
The indicator displays:
* Green BUY label = bullish signal
* Red SELL label = bearish signal
The chart labels are deliberately simple so that the underlying price action remains visible.
### Example 1 — Bullish trend continuation
Imagine the following sequence on a 5-minute chart:
1. Price is trading above VWAP.
2. Fast EMA is above slow EMA and rising.
3. RSI moves above the BUY threshold and continues rising.
4. +DI moves above -DI.
5. ADX is above the required minimum.
6. Price breaks the recent structure high.
7. A bullish candle closes with sufficient strength.
If the remaining filters agree, the indicator can print:
BUY
This should be interpreted as a bullish technical alignment, not as a guarantee that price will continue higher.
### Example 2 — Bearish trend continuation
Imagine the opposite sequence:
1. Price trades below VWAP.
2. Fast EMA is below slow EMA and falling.
3. RSI moves below the SELL threshold.
4. -DI exceeds +DI.
5. ADX satisfies the timeframe requirement.
6. Price breaks recent structure support.
7. A bearish candle closes with sufficient strength.
The indicator can then print:
SELL
Again, the signal represents technical conditions detected by the indicator and not a guaranteed future outcome.
### Example 3 — Reversal setup
Suppose price has been declining but momentum begins to change.
RSI crosses upward through its BUY threshold, +DI crosses above -DI, price moves above the fast EMA, and RSI moves above 50.
If the trend-quality, VWAP, candle, separation and noise filters also agree, the reversal route can generate a BUY signal.
The same concept applies in reverse for bearish reversals.
## Multi-timeframe dashboard
One of the main features of Gunjan Algo Edge All TF is its MTF dashboard.
The dashboard evaluates the indicator's signal framework across:
1m | 3m | 5m | 10m | 15m | 30m | 1h | 2h | 3h | 4h | 1D | 1W | 1Mo
The dashboard uses:
* B = BUY
* S = SELL
* — = NO SIGNAL
It also calculates an overall directional bias from the active timeframe signals.
### Dashboard example
A hypothetical dashboard could look like:
| 1m | 3m | 5m | 10m | 15m | 30m | 1h | 2h | 4h | 1D | Bias |
| -- | -- | -- | --- | --- | --- | -- | -- | -- | -- | ---- |
| B | B | B | B | B | B | B | — | B | B | BUY |
In this example, the lower and higher timeframes are generally aligned bullishly.
A different example:
| 1m | 3m | 5m | 10m | 15m | 30m | 1h | 2h | 4h | 1D | Bias |
| -- | -- | -- | --- | --- | --- | -- | -- | -- | -- | ----- |
| S | B | S | — | B | — | B | B | S | B | MIXED |
This indicates conflicting timeframe information.
A MIXED condition should generally be treated as a warning that the market does not have strong multi-timeframe agreement.
## Overall bias
The dashboard calculates the proportion of active BUY and SELL signals across its monitored timeframes.
The displayed bias is classified as:
* STRONG BUY
* BUY
* MIXED
* SELL
* STRONG SELL
* NO SIGNAL
The current implementation uses an 80% threshold for STRONG BUY/STRONG SELL and a 60% threshold for BUY/SELL.
The overall bias is a summary of the indicator's multi-timeframe technical state. It is not a prediction of future price.
## Suggested workflow
### Intraday traders
A practical workflow can be:
1. Start with the higher timeframes.
2. Check whether the 1h, 2h, 4h and daily signals generally agree.
3. Move to the intended execution timeframe.
4. Wait for the chart's BUY or SELL signal.
5. Check price structure and market context.
6. Define the trade's invalidation level before entering.
7. Determine position size according to your own risk rules.
8. Use the MTF dashboard as confirmation rather than treating it as an automatic trade command.
### Scalping
For short-term trading, the 1m, 3m and 5m columns can provide faster information, but lower timeframes generally contain more market noise.
Do not assume that a lower-timeframe signal is automatically superior to a higher-timeframe signal.
### Swing analysis
For higher-timeframe analysis, the 4h, daily, weekly and monthly readings can provide broader directional context.
A trader may use the higher timeframe for market bias and a lower timeframe for execution.
## Example decision framework
### Stronger bullish alignment
Higher timeframe: BUY
Execution timeframe: BUY
Lower timeframe: BUY
Price structure: bullish
VWAP context: bullish
Possible interpretation:
"Multiple technical components are aligned bullishly."
This is still not a guarantee of a profitable trade.
### Conflicting alignment
Higher timeframe: SELL
Execution timeframe: BUY
Lower timeframe: BUY
Possible interpretation:
"Short-term momentum is bullish while the broader trend remains bearish."
A trader may choose to wait for greater alignment rather than acting immediately.
## Settings
### Mode
**Auto**
Automatically selects the timeframe-specific parameter profile.
**Original 5M**
Uses the original 5-minute parameter configuration.
**Manual**
Allows the user to specify:
* Fast EMA
* Slow EMA
* RSI length
* DI length
* ADX smoothing
* Structure lookback
* Minimum ADX
The script exposes these controls directly in its settings.
### Adaptive Noise Filter
When enabled, the indicator applies additional directional conditions intended to reduce signals during less favorable price/EMA configurations.
### EMA Separation Filter
When enabled, the indicator requires the EMA relationship to satisfy the timeframe-specific separation condition.
### MTF Dashboard
The dashboard can be enabled/disabled and positioned at:
* Top Right
* Top Left
* Bottom Right
* Bottom Left
The overall bias display can also be enabled or disabled.
## Alerts
The indicator includes alert conditions for BUY and SELL signals.
Users can create TradingView alerts from these conditions and choose their preferred notification method.
Always verify the alert configuration and the selected symbol/timeframe before relying on alerts for live monitoring.
## Repainting and data handling
The MTF calculations use `request.security()` with `lookahead=barmerge.lookahead_off`, which avoids intentionally requesting future values from higher/lower timeframe calculations.
Signals on the current chart are additionally restricted to confirmed bars.
However, traders should understand that any real-time technical indicator can change its developing conditions while the current candle is still forming. For this reason, the published indicator is intended to be interpreted using confirmed signals rather than assuming that an intrabar condition is permanent.
## Recommended chart setup
For a clean TradingView publication:
* Use a standard candlestick chart.
* Keep the Gunjan Algo Edge All TF indicator clearly visible.
* Avoid unnecessary additional indicators on the publication screenshot.
* Show the complete symbol and timeframe.
* Make the BUY/SELL labels clearly visible.
* Keep the MTF dashboard readable.
* Use a chart section where the relationship between price action, signals and dashboard can be understood.
TradingView specifically recommends clean publication charts where the script's output is easy to identify.
## Important limitations
Gunjan Algo Edge All TF is a technical-analysis tool.
It does not:
* Predict the future with certainty.
* Guarantee profitable trades.
* Guarantee a particular win rate.
* Guarantee a particular risk/reward ratio.
* Eliminate losing trades.
* Replace risk management.
* Replace market or instrument-specific analysis.
* Guarantee that every BUY signal will result in a bullish move.
* Guarantee that every SELL signal will result in a bearish move.
Market conditions can change rapidly, and technical signals can fail during news events, volatility shocks, gaps, illiquid periods, sideways markets and other abnormal conditions.
The indicator should therefore be used as one component of a broader trading process.
## Risk management
Before taking any trade, consider:
* Entry price
* Invalidation level
* Stop-loss placement
* Position size
* Maximum acceptable loss
* Transaction costs
* Slippage
* Market liquidity
* Trading-session conditions
* Higher-timeframe context
Never risk capital that you cannot afford to lose.
## House Rules and publication compliance
This publication is written to provide a clear explanation of the indicator's purpose, methodology and usage without making unsupported performance claims.
The description intentionally does not claim a guaranteed win rate, guaranteed profitability, guaranteed accuracy or future performance.
TradingView's Script Publishing Rules require descriptions to explain what a script does, how it works and how traders can use it, while also prohibiting unrealistic or unsubstantiated performance claims.
The indicator should also be published with an original, clean chart and without misleading visual demonstrations. TradingView's House Rules prohibit plagiarism and require published content to be understandable and appropriately described.
If the script contains reused open-source code from another TradingView author, the appropriate author credit and reuse requirements must be satisfied before public publication. TradingView specifically requires attribution and additional conditions when qualifying open-source code is reused.
## Financial disclaimer
This indicator is provided for informational and educational purposes only.
Nothing in this indicator or its description constitutes investment advice, financial advice, a recommendation to buy or sell any security, derivative, cryptocurrency, commodity or other financial instrument, or a guarantee of future results.
Trading involves substantial risk. Past performance or historical behavior does not guarantee future results.
Users are responsible for their own trading decisions, risk management, due diligence and compliance with applicable laws and regulations.
## Final note
Gunjan Algo Edge All TF is best viewed as a structured market-analysis framework.
The goal is not to make every candle produce a signal. The system intentionally combines trend, momentum, structure, volatility/trend quality and multi-timeframe information so that traders can distinguish between directional alignment and conflicting market conditions.
Use the BUY and SELL labels as technical events, use the MTF dashboard as context, and combine the indicator with disciplined risk management and independent analysis.

Haftungsausschluss
Die Informationen und Veröffentlichungen sind nicht als Finanz-, Anlage-, Handels- oder andere Arten von Ratschlägen oder Empfehlungen gedacht, die von TradingView bereitgestellt oder gebilligt werden, und stellen diese nicht dar. Lesen Sie mehr in den Nutzungsbedingungen.
Haftungsausschluss
Die Informationen und Veröffentlichungen sind nicht als Finanz-, Anlage-, Handels- oder andere Arten von Ratschlägen oder Empfehlungen gedacht, die von TradingView bereitgestellt oder gebilligt werden, und stellen diese nicht dar. Lesen Sie mehr in den Nutzungsbedingungen.