OPEN-SOURCE SCRIPT
Aktualisiert Heatmap of NIFTY Top 40
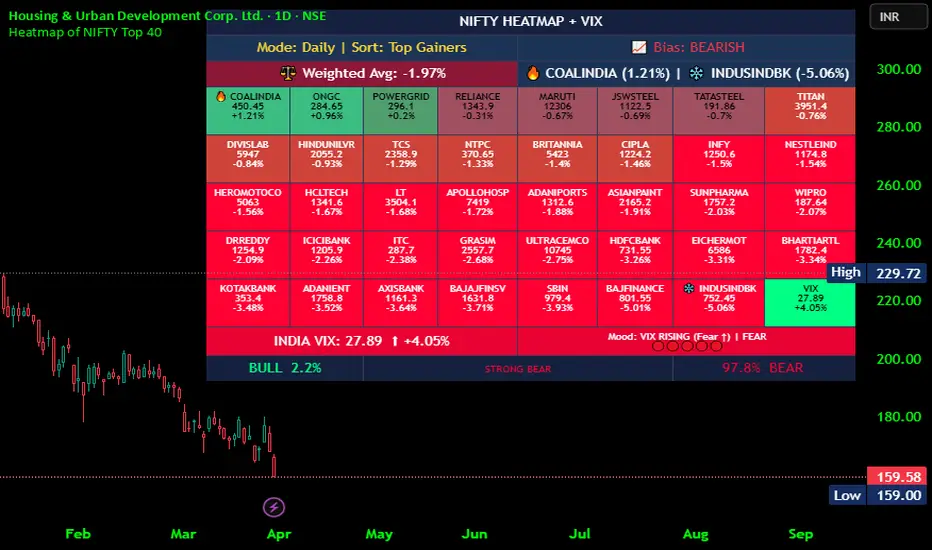
This indicator provides a comprehensive real-time Heatmap Dashboard for the top 40 stocks in the NIFTY index. It is designed to give traders an instant visual snapshot of market breadth, sentiment, and individual stock momentum directly on the chart. (TV has 40 script constraints)
Key Features:
Visual Heatmap: Displays 40 top NIFTY stocks in a color-coded grid. Cells transition from bright green (strong bullish) to bright red (strong bearish) based on percentage changes, allowing for instant pattern recognition.
Weighted Market Bias: Instead of a simple average, the script calculates market bias using weighted averages (assigning higher weights to heavyweights like Reliance and HDFC Bank). It classifies the market state as Bullish, Bearish, or Neutral.
Performance Modes: Users can toggle between Daily and Weekly performance views to analyze different timeframes.
🔥 Top Movers Highlight: Automatically identifies the session's top gainer (🔥) and top loser (❄️), displaying them prominently in the header and highlighting them within the grid.
🔄 Sorting Options: Features a "Sort Order" setting to arrange the dashboard by "Top Gainers" or "Top Losers," making it easy to spot momentum leaders.
Detailed Data: Each cell displays the Symbol Name, Current Price, and Percentage Change.
Customization: Fully adjustable settings for table position (Top Right, Bottom Left, etc.) and text size.
How to Use:
Add this script to your chart to monitor the internal strength of the NIFTY index. Use the "Weighted Avg" and "Market Bias" metrics in the header to determine the overall trend direction, and use the heatmap grid to spot sectoral strength or individual stock breakouts.
Credit & Attribution:
This script is based on the original concept and logic of NIFTY - Heatmap [DRK] by DhayalRamK.
Key Features:
Visual Heatmap: Displays 40 top NIFTY stocks in a color-coded grid. Cells transition from bright green (strong bullish) to bright red (strong bearish) based on percentage changes, allowing for instant pattern recognition.
Weighted Market Bias: Instead of a simple average, the script calculates market bias using weighted averages (assigning higher weights to heavyweights like Reliance and HDFC Bank). It classifies the market state as Bullish, Bearish, or Neutral.
Performance Modes: Users can toggle between Daily and Weekly performance views to analyze different timeframes.
🔥 Top Movers Highlight: Automatically identifies the session's top gainer (🔥) and top loser (❄️), displaying them prominently in the header and highlighting them within the grid.
🔄 Sorting Options: Features a "Sort Order" setting to arrange the dashboard by "Top Gainers" or "Top Losers," making it easy to spot momentum leaders.
Detailed Data: Each cell displays the Symbol Name, Current Price, and Percentage Change.
Customization: Fully adjustable settings for table position (Top Right, Bottom Left, etc.) and text size.
How to Use:
Add this script to your chart to monitor the internal strength of the NIFTY index. Use the "Weighted Avg" and "Market Bias" metrics in the header to determine the overall trend direction, and use the heatmap grid to spot sectoral strength or individual stock breakouts.
Credit & Attribution:
This script is based on the original concept and logic of NIFTY - Heatmap [DRK] by DhayalRamK.
Versionshinweise
Major Additions in v2:VIX Integration (Index 39)--
Replaced SBILIFE with India VIX ticker
VIX excluded from weighted average calculations (weight = 0.0)
VIX-Based Market Fear/Greed Meter--
Fear/Greed visual indicator with color-coded segments (🔴 for fear, 🟢 for greed)
VIX-driven mood labels: "RISING (Fear ↑)" or "FALLING (Calm ↑)"
VIX Multiplier for Bull/Bear Sentiment--
Adjusts bull/bear weighting based on VIX movements
Multipliers range from 0.80 (high fear) to 1.20 (high greed)
Expanded Dashboard Layout--
Increased from 8 rows to 11 rows
Row 8: VIX tracker with fear/greed meter
Row 9: Bull vs Bear sentiment label
Row 10: Bull vs Bear weighted visual
Refined Sorting Logic--
Stocks (0–38) can be sorted; VIX (index 39) always remains at position 39
Prevents VIX from interfering with sort order
Enhanced Top Gainer/Loser Logic--
Now excludes VIX when finding max/min changes
Summary: v2 transforms the heatmap into a VIX-aware market sentiment tool, adding fear/greed gauges and VIX-adjusted bull/bear weighting for deeper market psychology insights.
Open-source Skript
Ganz im Sinne von TradingView hat dieser Autor sein/ihr Script als Open-Source veröffentlicht. Auf diese Weise können nun auch andere Trader das Script rezensieren und die Funktionalität überprüfen. Vielen Dank an den Autor! Sie können das Script kostenlos verwenden, aber eine Wiederveröffentlichung des Codes unterliegt unseren Hausregeln.

Haftungsausschluss
Die Informationen und Veröffentlichungen sind nicht als Finanz-, Anlage-, Handels- oder andere Arten von Ratschlägen oder Empfehlungen gedacht, die von TradingView bereitgestellt oder gebilligt werden, und stellen diese nicht dar. Lesen Sie mehr in den Nutzungsbedingungen.
Open-source Skript
Ganz im Sinne von TradingView hat dieser Autor sein/ihr Script als Open-Source veröffentlicht. Auf diese Weise können nun auch andere Trader das Script rezensieren und die Funktionalität überprüfen. Vielen Dank an den Autor! Sie können das Script kostenlos verwenden, aber eine Wiederveröffentlichung des Codes unterliegt unseren Hausregeln.
Haftungsausschluss
Die Informationen und Veröffentlichungen sind nicht als Finanz-, Anlage-, Handels- oder andere Arten von Ratschlägen oder Empfehlungen gedacht, die von TradingView bereitgestellt oder gebilligt werden, und stellen diese nicht dar. Lesen Sie mehr in den Nutzungsbedingungen.