Normalized Trend Angle [Stoik]
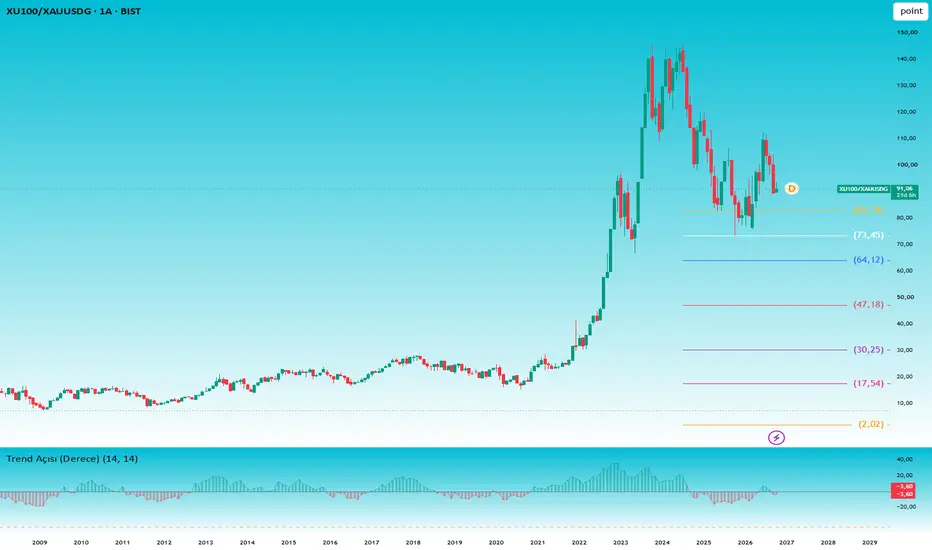
This indicator calculates the true angle of the current trend in degrees. Unlike traditional angle indicators that distort based on chart scale or asset price, this script normalizes the price movement using the Average True Range (ATR).
By dividing the price change by the current volatility (ATR), it accurately measures how much "energy" the asset spent over a given period, providing a standardized angle calculation that works seamlessly across all timeframes and assets.
How It Works:Delta Calculation: It calculates the price difference over a user-defined period and normalizes it using the ATR.Slope to Degrees: It calculates the slope ($\frac{\Delta Y}{\Delta X}$) and converts it into a readable degree format (using the arctangent function).Visual Feedback: The angle is plotted as both a line and a histogram, color-coded based on the strength and direction of the trend.
> +45° (Dark Green): Strong Bullish Trend. The asset is gaining significant upward momentum.
0° to +45° (Light Green): Mild Bullish Trend.
< -45° (Dark Red): Strong Bearish Trend. The asset is in a steep decline.
0° to -45° (Light Red): Mild Bearish Trend.
0° (Gray Line): Flat market / Consolidation.
By dividing the price change by the current volatility (ATR), it accurately measures how much "energy" the asset spent over a given period, providing a standardized angle calculation that works seamlessly across all timeframes and assets.
How It Works:Delta Calculation: It calculates the price difference over a user-defined period and normalizes it using the ATR.Slope to Degrees: It calculates the slope ($\frac{\Delta Y}{\Delta X}$) and converts it into a readable degree format (using the arctangent function).Visual Feedback: The angle is plotted as both a line and a histogram, color-coded based on the strength and direction of the trend.
> +45° (Dark Green): Strong Bullish Trend. The asset is gaining significant upward momentum.
0° to +45° (Light Green): Mild Bullish Trend.
< -45° (Dark Red): Strong Bearish Trend. The asset is in a steep decline.
0° to -45° (Light Red): Mild Bearish Trend.
0° (Gray Line): Flat market / Consolidation.

Haftungsausschluss
Die Informationen und Veröffentlichungen sind nicht als Finanz-, Anlage-, Handels- oder andere Arten von Ratschlägen oder Empfehlungen gedacht, die von TradingView bereitgestellt oder gebilligt werden, und stellen diese nicht dar. Lesen Sie mehr in den Nutzungsbedingungen.
Haftungsausschluss
Die Informationen und Veröffentlichungen sind nicht als Finanz-, Anlage-, Handels- oder andere Arten von Ratschlägen oder Empfehlungen gedacht, die von TradingView bereitgestellt oder gebilligt werden, und stellen diese nicht dar. Lesen Sie mehr in den Nutzungsbedingungen.