OPEN-SOURCE SCRIPT
RSI with Bullish/ Bearish Zones by VKK
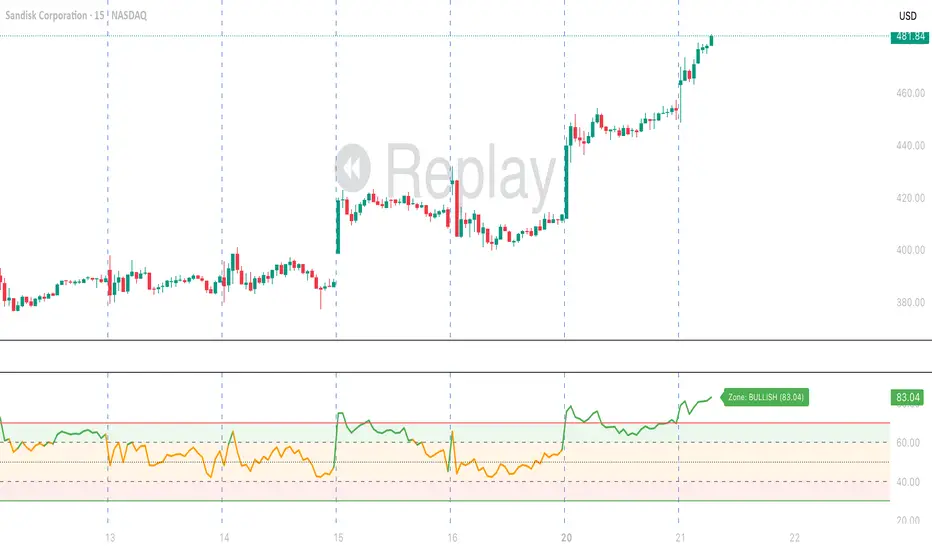
Disclaimer: Script is not suggesting any buy or sell any stock. It's a visual identification of the direction of the current state of the stock.
This script is a modified Relative Strength Index (RSI) designed to help traders filter out market noise by identifying three distinct momentum phases. Instead of the traditional 70/30 approach, this version uses the 40 and 60 levels to define a "Neutral/Caution" zone.
Key Features:
🟢 Bullish Zone (Above 60): Indicates strong upward momentum. The RSI line turns green, signaling a potential trend continuation.
🟠 Caution Zone (40–60): A neutral "no-man's land" where the market is often consolidating or undecided. The line turns orange, warning traders to be patient.
🔴 Bearish Zone (Below 40): Indicates strong downward momentum. The RSI line turns red, signaling a potential downtrend.
⚖️ Midline (50): A blue or your color choice dotted line acts as the ultimate pivot point between buyers and sellers.
🔥 Extremes (70/30): Classic Overbought (Red) and Oversold (Green) levels are included for mean-reversion context.
How to Use:
Trend Confirmation: Look for the RSI to sustain a position above 60 for longs or below 40 for shorts.
Filter Noise: Avoid entering aggressive trend trades when the RSI is stuck in the Orange Caution Zone.
Real-time Status: The dynamic label on the right provides an instant reading of the current market state and exact RSI value.
This script is a modified Relative Strength Index (RSI) designed to help traders filter out market noise by identifying three distinct momentum phases. Instead of the traditional 70/30 approach, this version uses the 40 and 60 levels to define a "Neutral/Caution" zone.
Key Features:
🟢 Bullish Zone (Above 60): Indicates strong upward momentum. The RSI line turns green, signaling a potential trend continuation.
🟠 Caution Zone (40–60): A neutral "no-man's land" where the market is often consolidating or undecided. The line turns orange, warning traders to be patient.
🔴 Bearish Zone (Below 40): Indicates strong downward momentum. The RSI line turns red, signaling a potential downtrend.
⚖️ Midline (50): A blue or your color choice dotted line acts as the ultimate pivot point between buyers and sellers.
🔥 Extremes (70/30): Classic Overbought (Red) and Oversold (Green) levels are included for mean-reversion context.
How to Use:
Trend Confirmation: Look for the RSI to sustain a position above 60 for longs or below 40 for shorts.
Filter Noise: Avoid entering aggressive trend trades when the RSI is stuck in the Orange Caution Zone.
Real-time Status: The dynamic label on the right provides an instant reading of the current market state and exact RSI value.
Open-source Skript
Ganz im Sinne von TradingView hat dieser Autor sein/ihr Script als Open-Source veröffentlicht. Auf diese Weise können nun auch andere Trader das Script rezensieren und die Funktionalität überprüfen. Vielen Dank an den Autor! Sie können das Script kostenlos verwenden, aber eine Wiederveröffentlichung des Codes unterliegt unseren Hausregeln.

Haftungsausschluss
Die Informationen und Veröffentlichungen sind nicht als Finanz-, Anlage-, Handels- oder andere Arten von Ratschlägen oder Empfehlungen gedacht, die von TradingView bereitgestellt oder gebilligt werden, und stellen diese nicht dar. Lesen Sie mehr in den Nutzungsbedingungen.
Open-source Skript
Ganz im Sinne von TradingView hat dieser Autor sein/ihr Script als Open-Source veröffentlicht. Auf diese Weise können nun auch andere Trader das Script rezensieren und die Funktionalität überprüfen. Vielen Dank an den Autor! Sie können das Script kostenlos verwenden, aber eine Wiederveröffentlichung des Codes unterliegt unseren Hausregeln.
Haftungsausschluss
Die Informationen und Veröffentlichungen sind nicht als Finanz-, Anlage-, Handels- oder andere Arten von Ratschlägen oder Empfehlungen gedacht, die von TradingView bereitgestellt oder gebilligt werden, und stellen diese nicht dar. Lesen Sie mehr in den Nutzungsbedingungen.