OPEN-SOURCE SCRIPT
Red Bull Wings [JOAT]
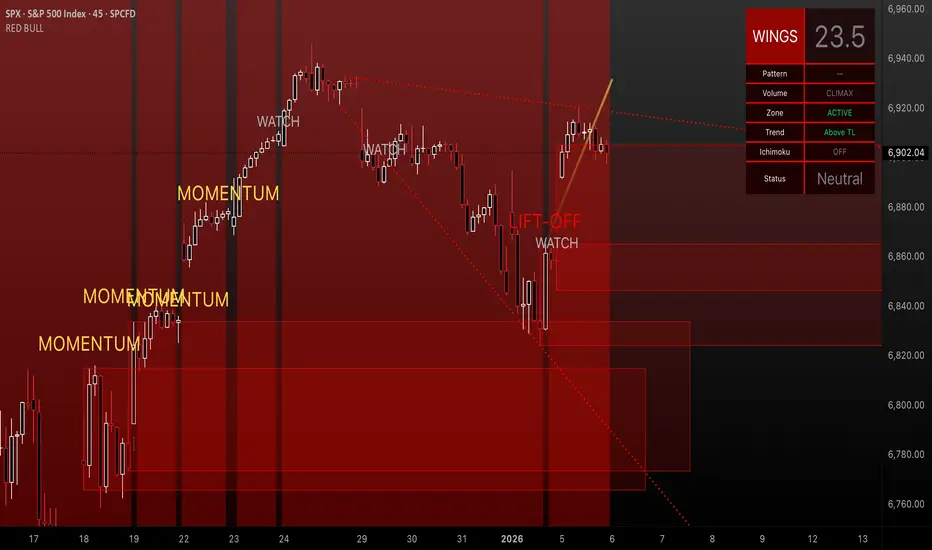
RED BULL WINGS - Bullish-Only Institutional Overlay
Introduction and Purpose
RED BULL WINGS is an open-source overlay indicator that combines five distinct bullish detection methods into a single composite scoring system. The core problem this indicator solves is that individual bullish signals (patterns, volume, zones, trendlines) often disagree or fire in isolation. A bullish engulfing pattern means little if volume is weak and price is far from support. Traders need confluence across multiple dimensions to identify high-probability setups.
This indicator addresses that by scoring each bullish component separately, then combining them into a weighted WINGS score (0-100) that reflects overall bullish conviction. When multiple components align, the score rises; when they disagree, the score stays low.
Why These Five Modules Work Together
Each module measures a different aspect of bullish market structure:
1. Module A - Bullish Candlestick Engine - Detects classic reversal patterns (engulfing, marubozu, hammer, 3-bar cluster). These patterns identify WHERE buyers are stepping in.
2. Module B - PVSRA Volume Climax - Measures spread x volume to detect institutional participation. This tells you WHETHER smart money is involved.
3. Module C - Demand Zone Detection - Identifies and tracks order block zones where buyers previously overwhelmed sellers. This shows you WHERE institutional support exists.
4. Module D - Trendline Channel - Builds dynamic support/resistance from pivot points. This reveals the STRUCTURE of the current trend.
5. Module E - Ichimoku Assist - Optional filter using Tenkan/Kijun cross, cloud position, and Chikou confirmation. This provides TREND PERMISSION context.
The combination works because:
How the Calculations Work
Module A - Pattern Detection:
Bullish Engulfing - Current bullish bar completely engulfs prior bearish bar:
Pine Script®
Marubozu - Strong body with minimal wicks (body >= 1.8x average, wick ratio < 20%):
Pine Script®
Hammer - Long lower wick (>= 2.5x body), close in upper third, volume confirmation:
Pine Script®
3-Bar Cluster - Three consecutive bullish closes with increasing prices and volume spike:
Pine Script®
Module B - PVSRA Volume Analysis:
Uses spread x volume to detect climax conditions:
Pine Script®
Volume only scores when the candle is bullish, preventing false signals on bearish volume spikes.
Module C - Demand Zone Detection:
Identifies zones using a two-candle structure:
Pine Script®
Zones are drawn as rectangles and tracked for retests. Score increases when price is near or inside an active zone, with bonus points for rejection candles.
Module D - Trendline Channel:
Builds dynamic channel from confirmed pivot points:
Pine Script®
Pivots are stored and connected to form upper/lower channel lines. The indicator detects breakouts when price closes beyond the channel with volume confirmation.
Module E - Ichimoku Assist:
Standard Ichimoku calculations with bullish scoring:
Pine Script®
Module F - WINGS Composite Score:
All module scores are combined using adjustable weights:
Pine Script®
Default weights: Pattern 30%, Volume 25%, Zone 20%, Trend 15%, Ichimoku 10%.
Signal Thresholds
WINGS Badge (Dashboard)
The right-side panel displays:
Input Parameters
Module Toggles:
Pattern Engine:
Volume / PVSRA:
Order Blocks:
Trendlines:
Ichimoku:
WINGS Score:
Visuals:
How to Use This Indicator
For Bullish Entry Identification:
1. Monitor the WINGS badge for score changes
2. Wait for MOMENTUM (50+) or LIFT-OFF (75+) signals
3. Check which modules are contributing (Pattern + Volume + Zone = stronger)
4. Use demand zones and trendlines as structural reference for entries
For Confluence Confirmation:
1. Use alongside your existing analysis
2. LIFT-OFF signals indicate multiple bullish factors aligning
3. Low scores (< 30) suggest weak bullish context even if one factor looks good
For Zone-Based Trading:
1. Watch for price approaching active demand zones
2. Look for pattern + volume confirmation at zone retests
3. Zone score increases with successful retests
For Trendline Analysis:
1. Monitor the pivot-based channel for trend structure
2. Breakouts with volume confirmation trigger TREND BREAK alerts
3. Price inside channel with bullish patterns = trend continuation setup
1M and lower timeframes:

Alerts Available
Repainting Behavior
By default, the indicator uses confirmed bars only (barstate.isconfirmed), meaning signals appear after the bar closes and do not repaint. However:
Live Mode with 'Enable Visual Effect' turned off in settings:

Limitations
Timeframe Recommendations
Adjust lookback periods and thresholds based on your timeframe. Shorter timeframes may benefit from shorter lookbacks.
Open-Source and Disclaimer
This script is published as open-source under the Mozilla Public License 2.0 for educational purposes. The source code is fully visible and can be studied to understand how each module works.
This indicator does not constitute financial advice. The WINGS score and signals do not guarantee profitable trades. Past performance does not guarantee future results. Always use proper risk management, position sizing, and stop-losses. Test thoroughly on your preferred instruments and timeframes before using in live trading.
- Made with passion by officialjackofalltrades
Introduction and Purpose
RED BULL WINGS is an open-source overlay indicator that combines five distinct bullish detection methods into a single composite scoring system. The core problem this indicator solves is that individual bullish signals (patterns, volume, zones, trendlines) often disagree or fire in isolation. A bullish engulfing pattern means little if volume is weak and price is far from support. Traders need confluence across multiple dimensions to identify high-probability setups.
This indicator addresses that by scoring each bullish component separately, then combining them into a weighted WINGS score (0-100) that reflects overall bullish conviction. When multiple components align, the score rises; when they disagree, the score stays low.
Why These Five Modules Work Together
Each module measures a different aspect of bullish market structure:
1. Module A - Bullish Candlestick Engine - Detects classic reversal patterns (engulfing, marubozu, hammer, 3-bar cluster). These patterns identify WHERE buyers are stepping in.
2. Module B - PVSRA Volume Climax - Measures spread x volume to detect institutional participation. This tells you WHETHER smart money is involved.
3. Module C - Demand Zone Detection - Identifies and tracks order block zones where buyers previously overwhelmed sellers. This shows you WHERE institutional support exists.
4. Module D - Trendline Channel - Builds dynamic support/resistance from pivot points. This reveals the STRUCTURE of the current trend.
5. Module E - Ichimoku Assist - Optional filter using Tenkan/Kijun cross, cloud position, and Chikou confirmation. This provides TREND PERMISSION context.
The combination works because:
- Patterns alone can fail without volume confirmation
- Volume alone means nothing without price structure context
- Zones alone are static without pattern/volume triggers
- Trendlines alone miss the micro-level entry timing
- When 3+ modules agree, the probability of a valid bullish setup increases significantly
How the Calculations Work
Module A - Pattern Detection:
Bullish Engulfing - Current bullish bar completely engulfs prior bearish bar:
Marubozu - Strong body with minimal wicks (body >= 1.8x average, wick ratio < 20%):
Hammer - Long lower wick (>= 2.5x body), close in upper third, volume confirmation:
3-Bar Cluster - Three consecutive bullish closes with increasing prices and volume spike:
Module B - PVSRA Volume Analysis:
Uses spread x volume to detect climax conditions:
Volume only scores when the candle is bullish, preventing false signals on bearish volume spikes.
Module C - Demand Zone Detection:
Identifies zones using a two-candle structure:
Zones are drawn as rectangles and tracked for retests. Score increases when price is near or inside an active zone, with bonus points for rejection candles.
Module D - Trendline Channel:
Builds dynamic channel from confirmed pivot points:
Pivots are stored and connected to form upper/lower channel lines. The indicator detects breakouts when price closes beyond the channel with volume confirmation.
Module E - Ichimoku Assist:
Standard Ichimoku calculations with bullish scoring:
Module F - WINGS Composite Score:
All module scores are combined using adjustable weights:
Default weights: Pattern 30%, Volume 25%, Zone 20%, Trend 15%, Ichimoku 10%.
Signal Thresholds
- WATCH (30-49) - Interesting bullish context forming, not yet actionable
- MOMENTUM (50-74) - Strong bullish conditions, multiple modules agreeing
- LIFT-OFF (75+) - High-confidence bullish confluence across most modules
WINGS Badge (Dashboard)
The right-side panel displays:
- WINGS Score - Current composite score (0-100)
- Pattern - Active pattern name and strength, or neutral placeholder
- Volume - Normal / Rising / CLIMAX status
- Zone - ACTIVE if price is near a demand zone
- Trend - Channel position or BREAK status
- Ichimoku - OFF / Weak / Bullish / STRONG
- Status - Overall signal level (Neutral / WATCH / MOMENTUM / LIFT-OFF)
Input Parameters
Module Toggles:
- Enable Bullish Patterns (true) - Toggle pattern detection
- Enable PVSRA Volume (true) - Toggle volume analysis
- Enable Order Blocks (true) - Toggle demand zone detection
- Enable Trendlines (true) - Toggle pivot channel
- Enable Ichimoku Assist (false) - Toggle Ichimoku filter (off by default for performance)
- Enable Visual Effects (false) - Toggle labels, trails, and visual elements
- LIVE MODE (false) - Enable intrabar signals (WARNING: signals may repaint)
Pattern Engine:
- Pattern Lookback (5) - Bars for body size averaging
- Marubozu Body Multiplier (1.8) - Minimum body size vs average
- Hammer Wick Multiplier (2.5) - Minimum lower wick vs body
- Max Wick Ratio (0.2) - Maximum wick percentage for marubozu
Volume / PVSRA:
- PVSRA Lookback (10) - Period for volume averaging
- Climax Multiplier (2.0) - Volume threshold for climax detection
- Rising Volume Multiplier (1.5) - Volume threshold for rising detection
Order Blocks:
- Zone Size Multiplier (2.0) - Minimum bullish candle size vs bearish
- Zone Extend Bars (200) - How far zones project forward
- Max Zones (12) - Maximum active zones displayed
- Remove Zone on Close Below (true) - Delete broken zones
Trendlines:
- Pivot Left/Right Bars (3/3) - Pivot detection sensitivity
- Min Slope % (0.25) - Minimum trendline angle
- Max Trendlines (5) - Maximum pivot points stored
- Trendline Projection Bars (60) - Forward projection distance
Ichimoku:
- Tenkan Length (9) - Conversion line period
- Kijun Length (26) - Base line period
- Senkou B Length (52) - Leading span B period
- Displacement (26) - Cloud displacement
WINGS Score:
- Weight: Pattern (0.30) - Pattern contribution to score
- Weight: Volume (0.25) - Volume contribution to score
- Weight: Zone (0.20) - Zone contribution to score
- Weight: Trend (0.15) - Trendline contribution to score
- Weight: Ichimoku (0.10) - Ichimoku contribution to score
- Lift-Off Threshold (75) - Score required for LIFT-OFF signal
- Momentum Watch Threshold (50) - Score required for MOMENTUM signal
Visuals:
- Signal Cooldown (8) - Minimum bars between labels
- Show WINGS Score Badge (true) - Toggle dashboard
- Show Wing Combos (true) - Show DOUBLE/MEGA WINGS streaks
- Red Background Wash (true) - Tint chart background
- Show Lift-Off Trails (false) - Toggle golden trail visuals
How to Use This Indicator
For Bullish Entry Identification:
1. Monitor the WINGS badge for score changes
2. Wait for MOMENTUM (50+) or LIFT-OFF (75+) signals
3. Check which modules are contributing (Pattern + Volume + Zone = stronger)
4. Use demand zones and trendlines as structural reference for entries
For Confluence Confirmation:
1. Use alongside your existing analysis
2. LIFT-OFF signals indicate multiple bullish factors aligning
3. Low scores (< 30) suggest weak bullish context even if one factor looks good
For Zone-Based Trading:
1. Watch for price approaching active demand zones
2. Look for pattern + volume confirmation at zone retests
3. Zone score increases with successful retests
For Trendline Analysis:
1. Monitor the pivot-based channel for trend structure
2. Breakouts with volume confirmation trigger TREND BREAK alerts
3. Price inside channel with bullish patterns = trend continuation setup
1M and lower timeframes:
Alerts Available
- LIFT-OFF - High-confidence bullish confluence
- MOMENTUM - Strong bullish conditions
- Zone Retest - Bullish rejection from demand zone
- Trendline Break - Breakout with volume confirmation
- Individual patterns (Engulfing, Marubozu, Hammer, 3-Bar Cluster)
- Volume Climax - Institutional volume spike
- DOUBLE WINGS / MEGA WINGS - Consecutive lift-off signals
Repainting Behavior
By default, the indicator uses confirmed bars only (barstate.isconfirmed), meaning signals appear after the bar closes and do not repaint. However:
- LIVE MODE - When enabled, signals can appear intrabar but may disappear if conditions change before bar close. A warning label displays when LIVE MODE is active.
- Trendlines - Pivot detection requires lookback bars, so the most recent trendline segments may adjust as new pivots confirm. This is inherent to pivot-based analysis.
- Demand Zones - Zones are created on confirmed bars and do not repaint, but they can be removed if price closes below the zone bottom (configurable).
Live Mode with 'Enable Visual Effect' turned off in settings:
Limitations
- This is a bullish-only indicator. It does not detect bearish setups or provide short signals.
- The WINGS score is a confluence measure, not a prediction. High scores indicate favorable conditions, not guaranteed outcomes.
- Pattern detection uses simplified logic. Not all candlestick nuances are captured.
- Volume analysis requires reliable volume data. Results may vary on instruments with inconsistent volume reporting.
- Ichimoku calculations add processing overhead. Disable if not needed.
- Demand zones are based on a specific two-candle structure. Other valid zones may not be detected.
- Trendlines use linear regression between pivots. Curved or complex channels are not supported.
Timeframe Recommendations
- 15m-1H: More frequent signals, useful for intraday analysis. Higher noise.
- 4H-Daily: Best balance of signal quality and frequency for swing trading.
- Weekly: Fewer but more significant signals for position trading.
Adjust lookback periods and thresholds based on your timeframe. Shorter timeframes may benefit from shorter lookbacks.
Open-Source and Disclaimer
This script is published as open-source under the Mozilla Public License 2.0 for educational purposes. The source code is fully visible and can be studied to understand how each module works.
This indicator does not constitute financial advice. The WINGS score and signals do not guarantee profitable trades. Past performance does not guarantee future results. Always use proper risk management, position sizing, and stop-losses. Test thoroughly on your preferred instruments and timeframes before using in live trading.
- Made with passion by officialjackofalltrades
Open-source Skript
Ganz im Sinne von TradingView hat dieser Autor sein/ihr Script als Open-Source veröffentlicht. Auf diese Weise können nun auch andere Trader das Script rezensieren und die Funktionalität überprüfen. Vielen Dank an den Autor! Sie können das Script kostenlos verwenden, aber eine Wiederveröffentlichung des Codes unterliegt unseren Hausregeln.

The Institutional Grade Trading Ecosystem, Built to win trades 📈
Get Access 👇
jackofalltrades.vip 🌐
t.me/jackofalltradesvip 🃏
Get Access 👇
jackofalltrades.vip 🌐
t.me/jackofalltradesvip 🃏
Haftungsausschluss
Die Informationen und Veröffentlichungen sind nicht als Finanz-, Anlage-, Handels- oder andere Arten von Ratschlägen oder Empfehlungen gedacht, die von TradingView bereitgestellt oder gebilligt werden, und stellen diese nicht dar. Lesen Sie mehr in den Nutzungsbedingungen.
Open-source Skript
Ganz im Sinne von TradingView hat dieser Autor sein/ihr Script als Open-Source veröffentlicht. Auf diese Weise können nun auch andere Trader das Script rezensieren und die Funktionalität überprüfen. Vielen Dank an den Autor! Sie können das Script kostenlos verwenden, aber eine Wiederveröffentlichung des Codes unterliegt unseren Hausregeln.
The Institutional Grade Trading Ecosystem, Built to win trades 📈
Get Access 👇
jackofalltrades.vip 🌐
t.me/jackofalltradesvip 🃏
Get Access 👇
jackofalltrades.vip 🌐
t.me/jackofalltradesvip 🃏
Haftungsausschluss
Die Informationen und Veröffentlichungen sind nicht als Finanz-, Anlage-, Handels- oder andere Arten von Ratschlägen oder Empfehlungen gedacht, die von TradingView bereitgestellt oder gebilligt werden, und stellen diese nicht dar. Lesen Sie mehr in den Nutzungsbedingungen.