OPEN-SOURCE SCRIPT
Stoch RSI - (Crossover Visual Upgrade)
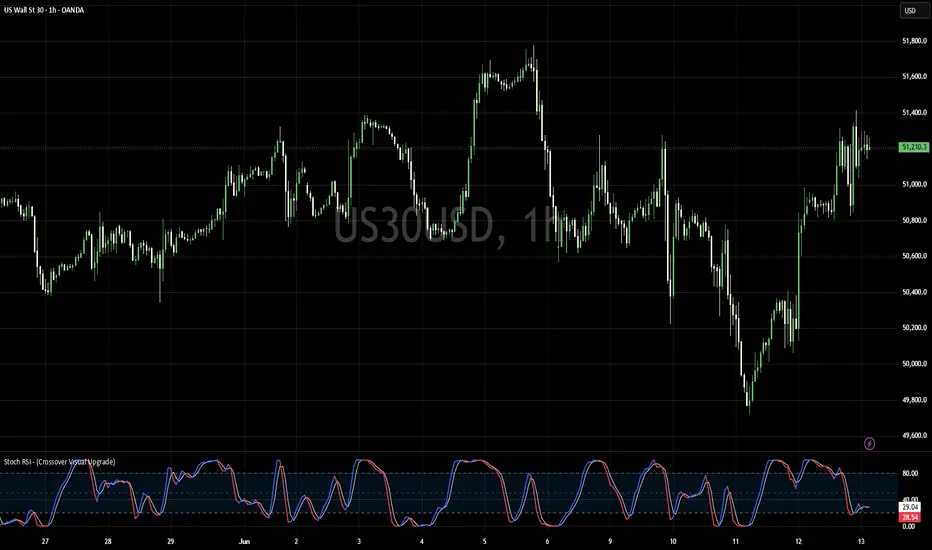
Stochastic RSI (Crossover Visual Upgrade) - Enhanced Momentum Indicator
This script is an optimized version of the standard Stochastic RSI. While maintaining the familiar logic of the original indicator, I have introduced a dynamic color-coding system for the K-line to help traders instantly identify momentum shifts and crossovers.
Why this version is useful:
In fast-paced markets, distinguishing between bullish and bearish momentum on a standard Stochastic RSI can be difficult. This version simplifies the process by automatically changing the color of the Fast K-line:
Blue: Indicates the Fast line (K) is above the Slow line (D), signaling potential bullish momentum.
Red: Indicates the Fast line (K) is below the Slow line (D), signaling potential bearish momentum.
This visual upgrade helps reduce eye strain and allows you to make quicker trading decisions without needing to closely track line overlaps.
Key Features:
Dynamic Color-Coding: Real-time color updates for the K-line based on its position relative to the D-line.
Clean Visuals: Retains the classic bands and structure while improving readability for day trading.
Lightweight & Efficient: Optimized for performance so it won't clutter your chart.
How to use:
Simply add the indicator to your chart. The Fast K-line will change color dynamically as it crosses the Slow D-line, giving you an immediate visual confirmation of the current momentum direction.
Author's Note:
I created this visual upgrade because I prefer a cleaner look when monitoring stochastic crossovers during fast trades. I wanted to remove the guesswork when glancing at the indicator. Since I found it very helpful for my own setup, I decided to share it with the community. Big thanks to Gemini for helping me craft this description. I hope you find this useful!
This script is an optimized version of the standard Stochastic RSI. While maintaining the familiar logic of the original indicator, I have introduced a dynamic color-coding system for the K-line to help traders instantly identify momentum shifts and crossovers.
Why this version is useful:
In fast-paced markets, distinguishing between bullish and bearish momentum on a standard Stochastic RSI can be difficult. This version simplifies the process by automatically changing the color of the Fast K-line:
Blue: Indicates the Fast line (K) is above the Slow line (D), signaling potential bullish momentum.
Red: Indicates the Fast line (K) is below the Slow line (D), signaling potential bearish momentum.
This visual upgrade helps reduce eye strain and allows you to make quicker trading decisions without needing to closely track line overlaps.
Key Features:
Dynamic Color-Coding: Real-time color updates for the K-line based on its position relative to the D-line.
Clean Visuals: Retains the classic bands and structure while improving readability for day trading.
Lightweight & Efficient: Optimized for performance so it won't clutter your chart.
How to use:
Simply add the indicator to your chart. The Fast K-line will change color dynamically as it crosses the Slow D-line, giving you an immediate visual confirmation of the current momentum direction.
Author's Note:
I created this visual upgrade because I prefer a cleaner look when monitoring stochastic crossovers during fast trades. I wanted to remove the guesswork when glancing at the indicator. Since I found it very helpful for my own setup, I decided to share it with the community. Big thanks to Gemini for helping me craft this description. I hope you find this useful!
Open-source Skript
Ganz im Sinne von TradingView hat dieser Autor sein/ihr Script als Open-Source veröffentlicht. Auf diese Weise können nun auch andere Trader das Script rezensieren und die Funktionalität überprüfen. Vielen Dank an den Autor! Sie können das Script kostenlos verwenden, aber eine Wiederveröffentlichung des Codes unterliegt unseren Hausregeln.

Haftungsausschluss
Die Informationen und Veröffentlichungen sind nicht als Finanz-, Anlage-, Handels- oder andere Arten von Ratschlägen oder Empfehlungen gedacht, die von TradingView bereitgestellt oder gebilligt werden, und stellen diese nicht dar. Lesen Sie mehr in den Nutzungsbedingungen.
Open-source Skript
Ganz im Sinne von TradingView hat dieser Autor sein/ihr Script als Open-Source veröffentlicht. Auf diese Weise können nun auch andere Trader das Script rezensieren und die Funktionalität überprüfen. Vielen Dank an den Autor! Sie können das Script kostenlos verwenden, aber eine Wiederveröffentlichung des Codes unterliegt unseren Hausregeln.
Haftungsausschluss
Die Informationen und Veröffentlichungen sind nicht als Finanz-, Anlage-, Handels- oder andere Arten von Ratschlägen oder Empfehlungen gedacht, die von TradingView bereitgestellt oder gebilligt werden, und stellen diese nicht dar. Lesen Sie mehr in den Nutzungsbedingungen.