OPEN-SOURCE SCRIPT
Aktualisiert P12 Session Levels
P12 – Previous 12 Hour Range
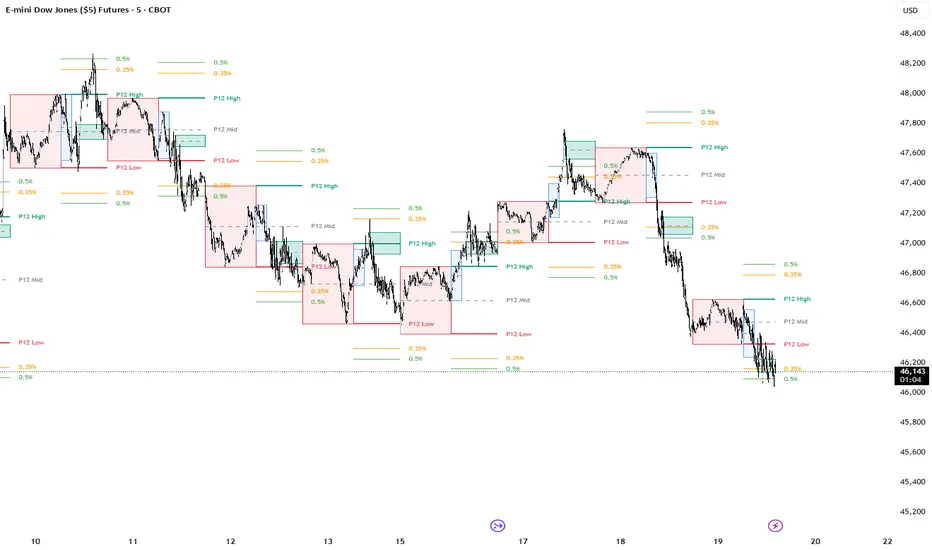
The P12 (Previous 12 Hour Range) indicator visualizes the high and low of the prior 12-hour period to provide a clear reference for current session context. The previous range can often act as a structural boundary where price may react, consolidate, or expand beyond as new liquidity enters the market.
By highlighting the prior 12-hour range directly on the chart, traders can quickly identify areas where price is interacting with recent market structure. Breaks, rejections, or rotations around this range can provide useful context for intraday analysis.
This concept is similar to approaches that study how price behaves relative to prior session ranges. Tools such as The Daily Profiler analyze historical session behavior to identify when highs and lows tend to occur. The P12 range provides a simple structural reference that traders can use alongside statistical timing studies, volume profile levels, or other forms of market structure analysis.
Features
Displays the high and low of the previous 12-hour range
Updates automatically as new sessions form
Helps visualize recent structural boundaries in the market
Can be combined with other analytical tools for context
This indicator is intended as a visual reference tool for studying market structure and range behavior and should be used alongside a trader’s existing analysis methods.
I personally use these extension levels with YM, you can find your own that work with you.
The P12 (Previous 12 Hour Range) indicator visualizes the high and low of the prior 12-hour period to provide a clear reference for current session context. The previous range can often act as a structural boundary where price may react, consolidate, or expand beyond as new liquidity enters the market.
By highlighting the prior 12-hour range directly on the chart, traders can quickly identify areas where price is interacting with recent market structure. Breaks, rejections, or rotations around this range can provide useful context for intraday analysis.
This concept is similar to approaches that study how price behaves relative to prior session ranges. Tools such as The Daily Profiler analyze historical session behavior to identify when highs and lows tend to occur. The P12 range provides a simple structural reference that traders can use alongside statistical timing studies, volume profile levels, or other forms of market structure analysis.
Features
Displays the high and low of the previous 12-hour range
Updates automatically as new sessions form
Helps visualize recent structural boundaries in the market
Can be combined with other analytical tools for context
This indicator is intended as a visual reference tool for studying market structure and range behavior and should be used alongside a trader’s existing analysis methods.
I personally use these extension levels with YM, you can find your own that work with you.
Versionshinweise
Updated extensions to change to user settings.Added 0600-0830 range and 930 opening range.
Versionshinweise
***Open-source Skript
Ganz im Sinne von TradingView hat dieser Autor sein/ihr Script als Open-Source veröffentlicht. Auf diese Weise können nun auch andere Trader das Script rezensieren und die Funktionalität überprüfen. Vielen Dank an den Autor! Sie können das Script kostenlos verwenden, aber eine Wiederveröffentlichung des Codes unterliegt unseren Hausregeln.

Haftungsausschluss
Die Informationen und Veröffentlichungen sind nicht als Finanz-, Anlage-, Handels- oder andere Arten von Ratschlägen oder Empfehlungen gedacht, die von TradingView bereitgestellt oder gebilligt werden, und stellen diese nicht dar. Lesen Sie mehr in den Nutzungsbedingungen.
Open-source Skript
Ganz im Sinne von TradingView hat dieser Autor sein/ihr Script als Open-Source veröffentlicht. Auf diese Weise können nun auch andere Trader das Script rezensieren und die Funktionalität überprüfen. Vielen Dank an den Autor! Sie können das Script kostenlos verwenden, aber eine Wiederveröffentlichung des Codes unterliegt unseren Hausregeln.
Haftungsausschluss
Die Informationen und Veröffentlichungen sind nicht als Finanz-, Anlage-, Handels- oder andere Arten von Ratschlägen oder Empfehlungen gedacht, die von TradingView bereitgestellt oder gebilligt werden, und stellen diese nicht dar. Lesen Sie mehr in den Nutzungsbedingungen.