Aktualisiert
[blackcat] L2 Barbara Star Supertrend Indicator
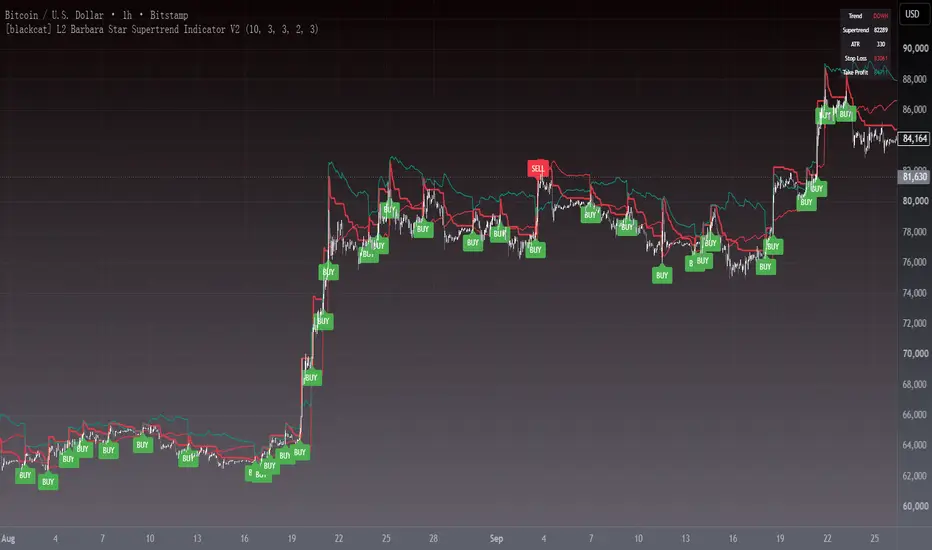
Level 2
Background
Barbara Star’s article on July 2023, “Stay On Track With The Supertrend Indicator”, I rewrote it as pine script for your information.
Function
A supertrend indicator is displayed either above or below the closing price to signal a buy or sell. The indicator changes color depending on whether you should buy or not. When the Supertrend indicator falls below the closing price, the indicator turns green, signaling one or more entry points to buy.
Author Barbara Star describes the Supertrend indicator and how it can be used as a means for traders to stay in sync with the larger trend. She explains how J. Welles Wilder's Average True Range (ATR) forms a basis for supertrend calculations. ATR does not measure price direction, but rather provides a measure of volatility over a period of time. The Supertrend indicator, on the other hand, provides a more comprehensive view of trend direction. In addition, the indicator provides price levels at which a trend reversal would occur.
Green color stands for up trend;
Red color stands for down trend.
Remarks
Feedbacks are appreciated.
Background
Barbara Star’s article on July 2023, “Stay On Track With The Supertrend Indicator”, I rewrote it as pine script for your information.
Function
A supertrend indicator is displayed either above or below the closing price to signal a buy or sell. The indicator changes color depending on whether you should buy or not. When the Supertrend indicator falls below the closing price, the indicator turns green, signaling one or more entry points to buy.
Author Barbara Star describes the Supertrend indicator and how it can be used as a means for traders to stay in sync with the larger trend. She explains how J. Welles Wilder's Average True Range (ATR) forms a basis for supertrend calculations. ATR does not measure price direction, but rather provides a measure of volatility over a period of time. The Supertrend indicator, on the other hand, provides a more comprehensive view of trend direction. In addition, the indicator provides price levels at which a trend reversal would occur.
Green color stands for up trend;
Red color stands for down trend.
Remarks
Feedbacks are appreciated.
Versionshinweise
OVERVIEWThe [blackcat] L2 Barbara Star Supertrend Indicator is a powerful tool designed to help traders identify trend direction and potential entry/exit points using the Supertrend algorithm. This indicator calculates the Supertrend line based on Average True Range (ATR) and plots it on the chart, providing clear visual signals for buying and selling opportunities. With customizable parameters and alert conditions, it offers flexibility for various trading strategies 📈💹.
FEATURES
Calculates the Supertrend line based on ATR and a user-defined multiplier:
ATR Length: Period for calculating Average True Range.
Multiplier: Factor applied to ATR for determining band widths.
Plots the Supertrend line on the chart with dynamic coloring:
Green when the price is above the Supertrend line (bullish).
Red when the price is below the Supertrend line (bearish).
Displays buy ('BUY') and sell ('SELL') labels on the chart for quick identification 🏷️
Generates alerts based on crossover events between the price and Supertrend line 🔔
Supports customizable alert messages for personalized notifications 🛎️
HOW TO USE
Add the indicator to your TradingView chart by selecting it from the indicators list.
Adjust the ATR Length and Multiplier parameters to suit your preferred sensitivity ⚙️.
Monitor the chart for buy and sell labels indicating potential trade opportunities.
Set up alerts based on the generated signals to receive notifications when conditions are met 📲.
Use the Supertrend line as a reference for trend direction and potential reversal points.
LIMITATIONS
The indicator may generate false signals in highly volatile or ranging markets 🌪️.
Users should combine this indicator with other forms of analysis for more reliable trading decisions.
The effectiveness of the indicator may vary depending on the asset and timeframe being analyzed.
NOTES
Ensure that you have sufficient historical data available for accurate calculations.
Test the indicator thoroughly on demo accounts before applying it to live trading 🔍.
Customize the appearance and parameters as needed to fit your trading strategy.
Versionshinweise
█ OVERVIEWThe L2 Barbara Star Supertrend Indicator V2 tracks trend direction with ATR-based volatility bands and prints BUY/SELL labels the moment the trend state flips. It also projects ATR-scaled stop-loss and take-profit reference levels for every fresh signal, plus a live dashboard so you can read the market at a glance.
This is a polished V2 of blackcat1402's open-source Supertrend script: same core engine, upgraded with signal governance, risk visuals and alerts.
█ CONCEPTS
The engine builds two volatility bands around the median price using the Average True Range:
• Upper band = median price + multiplier x ATR
• Lower band = median price - multiplier x ATR
When price closes below the upper band, the state flips bearish and the band becomes trailing resistance. When price closes above the lower band, the state flips bullish and the band becomes trailing support.
Signal governance layer:
• Edge-triggered flips — a signal fires only on the bar where the trend state changes, not on every bar of a trend
• Cooldown — optional minimum bar spacing between signals filters choppy whipsaws
• Same-bar exclusivity — conflicting signals can never fire on the same bar
█ HOW TO USE
1 — Add the script to your chart; it runs on any symbol and timeframe with default settings
2 — Tune ATR Length and Multiplier: larger values give wider bands and fewer, slower signals; smaller values give tighter bands and faster reactions
3 — Read the trend: green line + light green background = bullish, red line + light red background = bearish
4 — Act on BUY/SELL labels and use the projected SL (red) / TP (teal) lines as risk reference levels
5 — Create alerts from "Buy Alert" or "Sell Alert", or use "Any alert() function call" for dynamic messages
Input Parameters
• ATR Length (default 10) — lookback for the ATR volatility measure
• Multiplier (default 3.0) — band width in ATR units
• Cooldown Bars (default 3, 0 = off) — minimum bars between signals
• Same-bar Exclusivity (default on) — blocks conflicting same-bar signals
• Show TP/SL Levels (default on) — toggle the risk reference lines
• Stop Loss / Take Profit xATR (default 2.0 / 3.0) — distance of risk levels from entry in ATR units
• Show Signal Labels / State Background / Dashboard — visual toggles
█ FEATURES
• Edge-triggered BUY/SELL labels with anti-whipsaw cooldown
• ATR-scaled stop-loss and take-profit projection lines
• Trend state background tinting (green/red)
• Live dashboard: trend direction, Supertrend value, ATR, current SL/TP
• Two alertcondition channels plus dynamic alert() messages confirmed on bar close
• Non-repainting: no request.security, all state settles on bar close
█ SIGNALS
Visual Elements
• Green Supertrend line — bullish trend, the line trails below price as support
• Red Supertrend line — bearish trend, the line trails above price as resistance
• BUY label below the bar — trend flipped from bearish to bullish
• SELL label above the bar — trend flipped from bullish to bearish
• Red line — projected stop-loss for the most recent signal
• Teal line — projected take-profit for the most recent signal
█ IMPLEMENTATION NOTES
Open source under Mozilla Public License 2.0. Core engine: ta.atr bands around the median price with standard final-band tightening. V2 upgrades over V1: band-based direction state, edge-triggered signal state machine with cooldown and same-bar exclusivity, ATR TP/SL projection, dashboard, state background, dynamic alerts, and grouped inputs with tooltips.
█ LIMITATIONS
• Trend-following by nature — expect whipsaws in strong ranging markets; raise the Multiplier or ATR Length to reduce them
• TP/SL lines are reference projections, not orders — this is an indicator, not a strategy
• Best suited to trending markets and timeframes of 15m and above
• No financial advice — always validate signals within your own trading plan
█ NOTES
• V1 original by blackcat1402 (MPL 2.0); V2 polishing keeps the core engine intact
• Credits to Olivier Seban, the original creator of the Supertrend concept
════════════════════════════════════════════════════════════════════════
For questions or feedback, please use the comments section below.
Feel free to use and modify — attribution appreciated.

Don't miss out! The first and most important thing to do is to join my Discord chat now! Click here to start your adventure: discord.com/invite/ZTGpQJq My new github for more pine development soon: github.com/wxt-coder
Haftungsausschluss
Die Informationen und Veröffentlichungen sind nicht als Finanz-, Anlage-, Handels- oder andere Arten von Ratschlägen oder Empfehlungen gedacht, die von TradingView bereitgestellt oder gebilligt werden, und stellen diese nicht dar. Lesen Sie mehr in den Nutzungsbedingungen.
Don't miss out! The first and most important thing to do is to join my Discord chat now! Click here to start your adventure: discord.com/invite/ZTGpQJq My new github for more pine development soon: github.com/wxt-coder
Haftungsausschluss
Die Informationen und Veröffentlichungen sind nicht als Finanz-, Anlage-, Handels- oder andere Arten von Ratschlägen oder Empfehlungen gedacht, die von TradingView bereitgestellt oder gebilligt werden, und stellen diese nicht dar. Lesen Sie mehr in den Nutzungsbedingungen.