OPEN-SOURCE SCRIPT
Aktualisiert RSI StdDev Trend Breakout
Overview
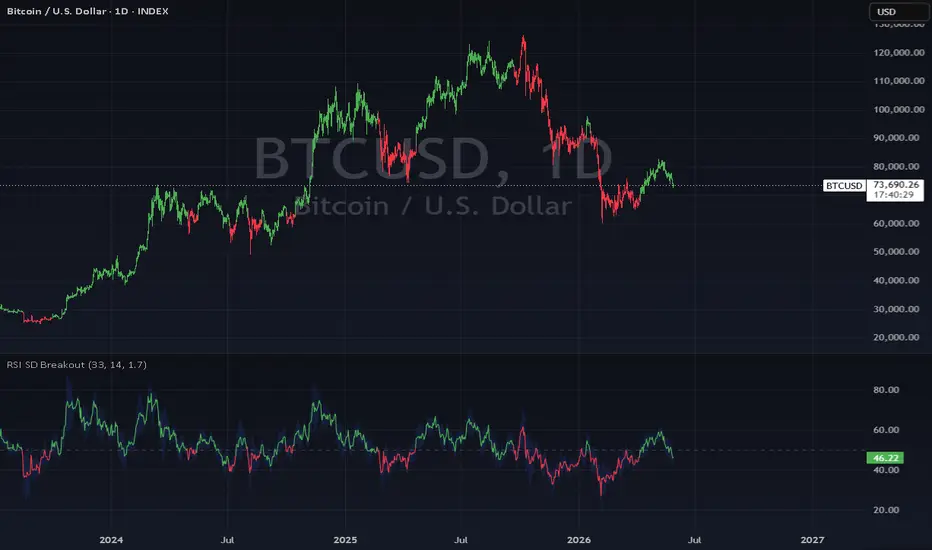
RSI StdDev Trend Breakout is a hybrid momentum and trend indicator built on the Relative Strength Index. It applies dynamic standard deviation bands directly to the RSI to detect meaningful breakout conditions, then uses the RSI midline as a trend filter to confirm bullish or bearish bias.
How It Works
The indicator calculates upper and lower standard deviation bands around the RSI. A bullish signal is triggered when the RSI breaks above the prior upper band while remaining above the midline, indicating upside momentum with trend confirmation. A bearish signal is triggered when the RSI breaks below the prior lower band while remaining below the midline, indicating downside momentum with trend confirmation. Once a bias is established, it persists until the opposing condition is met.
Visual Features
RSI line and candle colors update dynamically based on the current bullish or bearish state
Upper and lower standard deviation bands plotted with a filled channel for quick visual reference
Midline reference at 50 for trend context
Inputs
RSI Length - controls the RSI calculation period
StdDev Period - controls the lookback for standard deviation band calculation
StdDev Multiplier - adjusts the width of the bands
Alerts
Bullish: RSI > 50 and breaks above the upper standard deviation band
Bearish: RSI < 50 and breaks below the lower standard deviation band
RSI StdDev Trend Breakout is a hybrid momentum and trend indicator built on the Relative Strength Index. It applies dynamic standard deviation bands directly to the RSI to detect meaningful breakout conditions, then uses the RSI midline as a trend filter to confirm bullish or bearish bias.
How It Works
The indicator calculates upper and lower standard deviation bands around the RSI. A bullish signal is triggered when the RSI breaks above the prior upper band while remaining above the midline, indicating upside momentum with trend confirmation. A bearish signal is triggered when the RSI breaks below the prior lower band while remaining below the midline, indicating downside momentum with trend confirmation. Once a bias is established, it persists until the opposing condition is met.
Visual Features
RSI line and candle colors update dynamically based on the current bullish or bearish state
Upper and lower standard deviation bands plotted with a filled channel for quick visual reference
Midline reference at 50 for trend context
Inputs
RSI Length - controls the RSI calculation period
StdDev Period - controls the lookback for standard deviation band calculation
StdDev Multiplier - adjusts the width of the bands
Alerts
Bullish: RSI > 50 and breaks above the upper standard deviation band
Bearish: RSI < 50 and breaks below the lower standard deviation band
Versionshinweise
.Open-source Skript
Ganz im Sinne von TradingView hat dieser Autor sein/ihr Script als Open-Source veröffentlicht. Auf diese Weise können nun auch andere Trader das Script rezensieren und die Funktionalität überprüfen. Vielen Dank an den Autor! Sie können das Script kostenlos verwenden, aber eine Wiederveröffentlichung des Codes unterliegt unseren Hausregeln.

Haftungsausschluss
Die Informationen und Veröffentlichungen sind nicht als Finanz-, Anlage-, Handels- oder andere Arten von Ratschlägen oder Empfehlungen gedacht, die von TradingView bereitgestellt oder gebilligt werden, und stellen diese nicht dar. Lesen Sie mehr in den Nutzungsbedingungen.
Open-source Skript
Ganz im Sinne von TradingView hat dieser Autor sein/ihr Script als Open-Source veröffentlicht. Auf diese Weise können nun auch andere Trader das Script rezensieren und die Funktionalität überprüfen. Vielen Dank an den Autor! Sie können das Script kostenlos verwenden, aber eine Wiederveröffentlichung des Codes unterliegt unseren Hausregeln.
Haftungsausschluss
Die Informationen und Veröffentlichungen sind nicht als Finanz-, Anlage-, Handels- oder andere Arten von Ratschlägen oder Empfehlungen gedacht, die von TradingView bereitgestellt oder gebilligt werden, und stellen diese nicht dar. Lesen Sie mehr in den Nutzungsbedingungen.