OPEN-SOURCE SCRIPT
TTwinCloud W-D Dual Timeframe Ichimoku Cloud
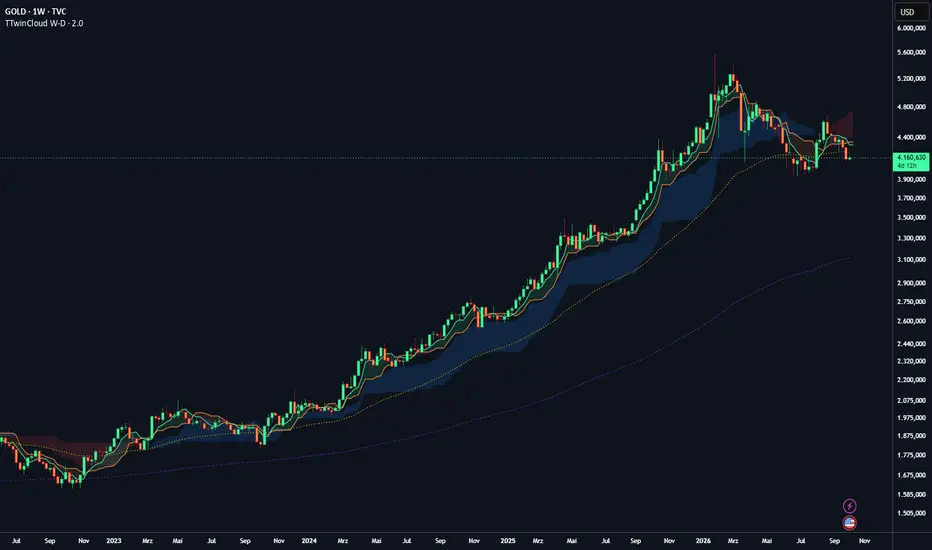
As an example and for explanatory purposes, I use the Gold chart (XAU/USD) here.
🗺️ OVERVIEW 🗺️
TTwinCloud W/D is a TradingView indicator that overlays two Ichimoku clouds on a single chart: a Weekly cloud and a Daily cloud.
Two Weekly EMAs are added as a long-term trend filter.
The name breaks down as follows:
• TT — the author's TradingView handle (TT136 / TigerTwin136)
• win — Twin
• Cloud — the Ichimoku clouds
• W/D — Weekly / Daily

💡 THE IDEA BEHIND IT 💡
Standard Ichimoku shows only one cloud — the one belonging to your current chart timeframe. To see what a higher timeframe is doing, you have to switch charts.
TTwinCloud W/D solves this by showing both levels at once:
• The Weekly cloud shows the higher-level trend (the big picture).
• The Daily cloud shows the finer structure (closer to price action).
This enables cross-timeframe analysis without leaving the chart.
It is particularly useful for Elliott Wave and MSB (Market Structure Break) analysis.
☁️☁️ THE TWO CLOUDS ☁️☁️
Each cloud is built from two lines:
• Lead A (Leading Span A) — the average of Tenkan and Kijun.
• Lead B (Leading Span B) — the average of the highest high and lowest low over the Senkou B period.
The area between these two lines is filled — that is the cloud.
The Weekly cloud is always calculated from the 1W timeframe.
The Daily cloud is always calculated from the 1D timeframe.
This applies regardless of which chart timeframe you are currently viewing.

🔵🔴 COLOR LOGIC (DYNAMIC FILLS) 🟢🟠
The fill colors switch automatically depending on which line is on top:
• When Lead A is above Lead B → blue fill for Weekly, mint green for Daily.
• When Lead A is below Lead B → red fill for Weekly, orange for Daily.
This acts as a visual trend indicator:
• Blue / mint green → bullish condition.
• Red / orange → bearish condition.
An important difference:
The Weekly fills are stronger (transparency 85), while the Daily fills are lighter (transparency 90). This is intentional — the Weekly level is more significant, so it visually dominates.
⚙️ ICHIMOKU PRESETS (FIXED) ⚙️
Instead of letting the user adjust every single Ichimoku value, TTwinCloud W/D offers three fixed presets:
• Original Japanese (9 / 26 / 52)
• Western (8 / 22 / 44)
• Fibonacci (8 / 34 / 55)
Background:
• The original values (9 / 26 / 52) come from the Japanese trading calendar: 9 = 1.5 weeks, 26 = 1 month, 52 = 2 months — based on the historical 6-day trading week in Japan.
• The Western values (8 / 22 / 44) are the adaptation to the 5-day trading week used in Western markets.
• The Fibonacci values (8 / 34 / 55) follow the Fibonacci sequence.
Once a preset is selected, the values are applied firmly.
There is no further room for adjustment.
This is intentional, so that the clouds remain consistent.

⏩ CLOUD OFFSET ⏩
This is the only setting the user is free to adjust.
The offset determines how far the clouds are projected into the future:
• Standard Ichimoku uses an offset of 26 (the cloud extends 26 periods ahead).
• TTwinCloud W/D defaults to 1, keeping the cloud close to price action.
The user can shift this value freely from 0 to 200 — and both clouds (Weekly and Daily) move together.
🟡🟣 WEEKLY EMAs 🟡🟣
In addition to the clouds, two exponential moving averages run on a weekly basis:
• EMA 1: default 55, gold color (#ffd700), dotted.
• EMA 2: default 233, purple color (#b026ff), dotted.
These EMAs are freely adjustable — the user can change the periods.
They serve as trend confirmation:
when price is above both EMAs, the long-term trend is intact.
⏱️ TIMEFRAME LOGIC ⏱️
The clouds are automatically shown or hidden depending on your chart timeframe, because they are not useful on every level:

• Monthly chart (1M): Weekly cloud ON, Daily cloud OFF.

• Weekly (1W), Daily (1D), 4H, 1H: both clouds ON.

• Below 60 minutes (30m, 15m, 5m, 1m): Weekly cloud OFF, Daily cloud ON.
The logic:
• On the Monthly chart, the Daily cloud is too fine-grained and distracts → it is hidden.
• Below 60 minutes, the Weekly cloud is too coarse → it is hidden.
This keeps the chart clean and shows only the relevant levels.
🔍 SCALING 🔍
The indicator is attached to the main price scale.
There is no separate scale, which means the clouds will not shift away when you move or zoom the chart.
🛠️ STYLE & CUSTOMIZATION 🛠️
All colors and line styles in TTwinCloud W/D are fully customizable.
The colors listed above are simply the author's default choices — they are not fixed.
The user has complete freedom to adjust:
• Line colors for Weekly Lead A, Weekly Lead B, Daily Lead A, Daily Lead B
• Fill colors for both clouds (bullish and bearish states)
• EMA colors
• Line thickness and line style (solid, dotted, dashed)
• Visibility of individual elements (lines can be turned on or off in the Style tab)
Every visual aspect can be tailored to personal preference.
The defaults are only a starting point.

📝 SUMMARY 📝
TTwinCloud W/D is a dual-timeframe Ichimoku indicator that displays the Weekly and Daily clouds simultaneously, with fixed presets for the Ichimoku values, a shared cloud offset, two Weekly EMAs as a trend filter, and an automatic timeframe logic that shows or hides each cloud depending on the chart level.
⚠️ DISCLAIMER ⚠️
This indicator is provided for informational and educational purposes only.
It does not constitute financial advice, investment recommendations, or a solicitation to buy or sell any instrument.
Trading involves a high level of risk and may result in the loss of invested capital.
Past performance does not guarantee future results.
The user is solely responsible for their own trading decisions.
Use this script at your own risk.
🗺️ OVERVIEW 🗺️
TTwinCloud W/D is a TradingView indicator that overlays two Ichimoku clouds on a single chart: a Weekly cloud and a Daily cloud.
Two Weekly EMAs are added as a long-term trend filter.
The name breaks down as follows:
• TT — the author's TradingView handle (TT136 / TigerTwin136)
• win — Twin
• Cloud — the Ichimoku clouds
• W/D — Weekly / Daily
💡 THE IDEA BEHIND IT 💡
Standard Ichimoku shows only one cloud — the one belonging to your current chart timeframe. To see what a higher timeframe is doing, you have to switch charts.
TTwinCloud W/D solves this by showing both levels at once:
• The Weekly cloud shows the higher-level trend (the big picture).
• The Daily cloud shows the finer structure (closer to price action).
This enables cross-timeframe analysis without leaving the chart.
It is particularly useful for Elliott Wave and MSB (Market Structure Break) analysis.
☁️☁️ THE TWO CLOUDS ☁️☁️
Each cloud is built from two lines:
• Lead A (Leading Span A) — the average of Tenkan and Kijun.
• Lead B (Leading Span B) — the average of the highest high and lowest low over the Senkou B period.
The area between these two lines is filled — that is the cloud.
The Weekly cloud is always calculated from the 1W timeframe.
The Daily cloud is always calculated from the 1D timeframe.
This applies regardless of which chart timeframe you are currently viewing.
🔵🔴 COLOR LOGIC (DYNAMIC FILLS) 🟢🟠
The fill colors switch automatically depending on which line is on top:
• When Lead A is above Lead B → blue fill for Weekly, mint green for Daily.
• When Lead A is below Lead B → red fill for Weekly, orange for Daily.
This acts as a visual trend indicator:
• Blue / mint green → bullish condition.
• Red / orange → bearish condition.
An important difference:
The Weekly fills are stronger (transparency 85), while the Daily fills are lighter (transparency 90). This is intentional — the Weekly level is more significant, so it visually dominates.
⚙️ ICHIMOKU PRESETS (FIXED) ⚙️
Instead of letting the user adjust every single Ichimoku value, TTwinCloud W/D offers three fixed presets:
• Original Japanese (9 / 26 / 52)
• Western (8 / 22 / 44)
• Fibonacci (8 / 34 / 55)
Background:
• The original values (9 / 26 / 52) come from the Japanese trading calendar: 9 = 1.5 weeks, 26 = 1 month, 52 = 2 months — based on the historical 6-day trading week in Japan.
• The Western values (8 / 22 / 44) are the adaptation to the 5-day trading week used in Western markets.
• The Fibonacci values (8 / 34 / 55) follow the Fibonacci sequence.
Once a preset is selected, the values are applied firmly.
There is no further room for adjustment.
This is intentional, so that the clouds remain consistent.
⏩ CLOUD OFFSET ⏩
This is the only setting the user is free to adjust.
The offset determines how far the clouds are projected into the future:
• Standard Ichimoku uses an offset of 26 (the cloud extends 26 periods ahead).
• TTwinCloud W/D defaults to 1, keeping the cloud close to price action.
The user can shift this value freely from 0 to 200 — and both clouds (Weekly and Daily) move together.
🟡🟣 WEEKLY EMAs 🟡🟣
In addition to the clouds, two exponential moving averages run on a weekly basis:
• EMA 1: default 55, gold color (#ffd700), dotted.
• EMA 2: default 233, purple color (#b026ff), dotted.
These EMAs are freely adjustable — the user can change the periods.
They serve as trend confirmation:
when price is above both EMAs, the long-term trend is intact.
⏱️ TIMEFRAME LOGIC ⏱️
The clouds are automatically shown or hidden depending on your chart timeframe, because they are not useful on every level:
• Monthly chart (1M): Weekly cloud ON, Daily cloud OFF.
• Weekly (1W), Daily (1D), 4H, 1H: both clouds ON.
• Below 60 minutes (30m, 15m, 5m, 1m): Weekly cloud OFF, Daily cloud ON.
The logic:
• On the Monthly chart, the Daily cloud is too fine-grained and distracts → it is hidden.
• Below 60 minutes, the Weekly cloud is too coarse → it is hidden.
This keeps the chart clean and shows only the relevant levels.
🔍 SCALING 🔍
The indicator is attached to the main price scale.
There is no separate scale, which means the clouds will not shift away when you move or zoom the chart.
🛠️ STYLE & CUSTOMIZATION 🛠️
All colors and line styles in TTwinCloud W/D are fully customizable.
The colors listed above are simply the author's default choices — they are not fixed.
The user has complete freedom to adjust:
• Line colors for Weekly Lead A, Weekly Lead B, Daily Lead A, Daily Lead B
• Fill colors for both clouds (bullish and bearish states)
• EMA colors
• Line thickness and line style (solid, dotted, dashed)
• Visibility of individual elements (lines can be turned on or off in the Style tab)
Every visual aspect can be tailored to personal preference.
The defaults are only a starting point.
📝 SUMMARY 📝
TTwinCloud W/D is a dual-timeframe Ichimoku indicator that displays the Weekly and Daily clouds simultaneously, with fixed presets for the Ichimoku values, a shared cloud offset, two Weekly EMAs as a trend filter, and an automatic timeframe logic that shows or hides each cloud depending on the chart level.
⚠️ DISCLAIMER ⚠️
This indicator is provided for informational and educational purposes only.
It does not constitute financial advice, investment recommendations, or a solicitation to buy or sell any instrument.
Trading involves a high level of risk and may result in the loss of invested capital.
Past performance does not guarantee future results.
The user is solely responsible for their own trading decisions.
Use this script at your own risk.
Open-source Skript
Ganz im Sinne von TradingView hat dieser Autor sein/ihr Script als Open-Source veröffentlicht. Auf diese Weise können nun auch andere Trader das Script rezensieren und die Funktionalität überprüfen. Vielen Dank an den Autor! Sie können das Script kostenlos verwenden, aber eine Wiederveröffentlichung des Codes unterliegt unseren Hausregeln.

Haftungsausschluss
Die Informationen und Veröffentlichungen sind nicht als Finanz-, Anlage-, Handels- oder andere Arten von Ratschlägen oder Empfehlungen gedacht, die von TradingView bereitgestellt oder gebilligt werden, und stellen diese nicht dar. Lesen Sie mehr in den Nutzungsbedingungen.
Open-source Skript
Ganz im Sinne von TradingView hat dieser Autor sein/ihr Script als Open-Source veröffentlicht. Auf diese Weise können nun auch andere Trader das Script rezensieren und die Funktionalität überprüfen. Vielen Dank an den Autor! Sie können das Script kostenlos verwenden, aber eine Wiederveröffentlichung des Codes unterliegt unseren Hausregeln.
Haftungsausschluss
Die Informationen und Veröffentlichungen sind nicht als Finanz-, Anlage-, Handels- oder andere Arten von Ratschlägen oder Empfehlungen gedacht, die von TradingView bereitgestellt oder gebilligt werden, und stellen diese nicht dar. Lesen Sie mehr in den Nutzungsbedingungen.