OPEN-SOURCE SCRIPT
SwingTrades-Long-Daily
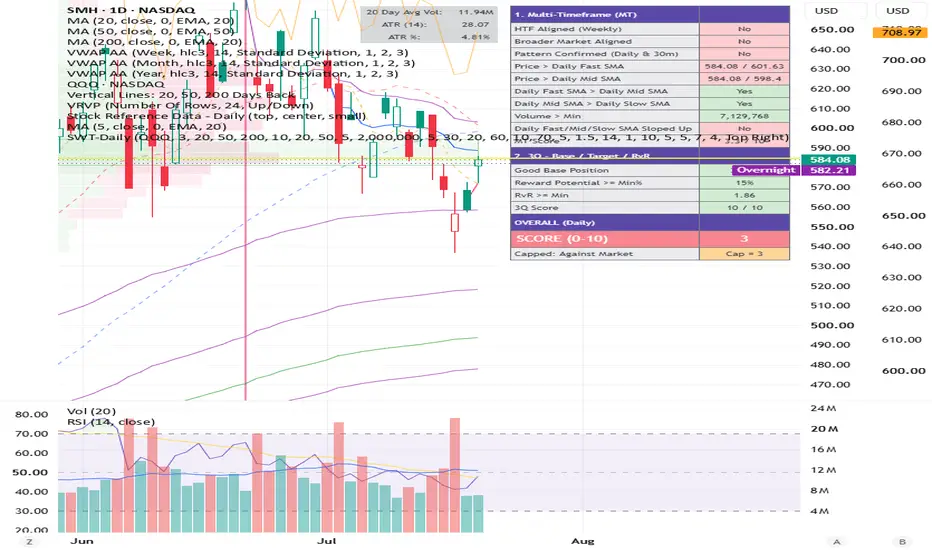
// =====================================================================================
// SwingTrades-Long-Daily — WHAT THIS INDICATOR DOES AND HOW (read this first)
// =====================================================================================
// THIS IS HALF OF A PAIR
// SwingTrades-Long used to be one script covering 4 categories (MT, 3Q, TR, R). It
// has been split into two independent indicators so each runs on the timeframe that
// actually fits its checks:
// - SwingTrades-Long-Daily (THIS script) — Category 1 (MT) + Category 2 (3Q).
// Runs on the DAILY chart. Answers: "is this stock structurally set up to buy,
// and is the trade worth the reward vs. risk?" Updates once per day.
// - SwingTrades-Long-30Mins (companion script) — Category 3 (TR) + Category 4 (R).
// Runs on the 30-MINUTE chart. Answers: "right now, intraday, is this a safe
// moment to pull the trigger, and how big should the position be?" Updates
// every 30 minutes throughout the session.
// The two scripts are fully independent — each computes and displays its OWN 0-10
// score. There is no shared/combined score across the pair. Run both side by side
// (Daily chart + 30-min chart): use Daily to decide whether to even be watching a
// stock, and 30-Min to decide whether right now is the moment to act.
//
// PURPOSE OF THIS SCRIPT
// Scores a stock 0-10 on: (1) Multi-Timeframe Price Action — is price aligned with
// higher timeframes, the broader market, and in an uptrend structure — and (2) 3Q —
// where has it come from, where can it go, and is the reward-vs-risk worth it. Every
// threshold is a configurable input.
//
// WHERE DATA COMES FROM
// - Runs on a DAILY chart. Daily Fast/Mid/Slow SMA (defaults 20/50/200), a separate
// Daily 5-SMA (used only for the 30-min pattern check), ATR, and volume are native.
// - Weekly data (HTF alignment) uses its OWN independently configurable Fast/Mid/Slow
// SMA lengths (defaults 10/20/50) — Daily and Weekly lengths are no longer tied
// together. The benchmark symbol (broader market alignment) is also pulled via
// request.security(), on "D", reusing the Daily Mid SMA length.
// - The 30-minute timeframe is pulled via request.security() purely to help confirm
// the "pattern" check (1.b.i) — the Trend Reading / Risk checks that used to also
// reference intraday data now live entirely in the companion 30-min script.
//
// STEP-BY-STEP LOGIC
// STEP A — Inputs, grouped by category.
// STEP B — Daily-native series: Daily Fast/Mid/Slow SMA, a separate Daily 5-SMA, ATR,
// and their "rising" slope flags.
// STEP C — Multi-timeframe pulls: Weekly (HTF, using its own Fast/Mid/Slow lengths),
// Benchmark (broader market), 30-min (just the close, for the pattern check).
// STEP D — 1. MULTI-TIMEFRAME PRICE ACTION (MT) — 9 checks, category score /10:
// a. HTF Aligned (Weekly) — weekly close > rising Weekly Fast SMA, AND
// Weekly Fast SMA > Weekly Mid SMA > Weekly Slow
// SMA (a full weekly SMA-stack check, mirroring
// the Daily stack checks below)
// b. Broader Market Aligned — benchmark close > rising benchmark Daily Mid
// SMA
// c. Pattern Confirmed — Daily price above a rising Daily Fast SMA, AND
// the current 30-min close is above the Daily
// 5-SMA AND that Daily 5-SMA is sloped up (see
// pattern-recognition note below)
// d. Price > Daily Fast SMA
// e. Price > Daily Mid SMA
// f. Daily Fast SMA > Daily Mid SMA
// g. Daily Mid SMA > Daily Slow SMA
// h. Volume > configured minimum
// i. Daily Fast, Mid, AND Slow SMA all sloped up
// NOTE: true chart-pattern recognition (flags, H&S, triangles, etc.) can't
// be reliably automated in Pine. The Daily side of "pattern confirmed" is
// approximated as price trading above a rising short-term SMA; the 30-min
// side checks that the live 30-min price is above the Daily 5-SMA AND that
// the Daily 5-SMA itself is sloped up — not a full trend-structure test.
// STEP E — 2. 3Q — BASE / TARGET / RvR — 3 checks, category score /10:
// a. Good Base Position — where close sits (%) within the recent N-bar
// high/low range ("where has it come from?")
// b. Reward Potential — % distance from close to the recent M-bar high
// ("where can it go?")
// c. RvR >= minimum — reward (target - close) vs risk (close - a local
// ATR/swing-low stop) ("is it worth it?"). NOTE: this stop is only used
// to size the RvR ratio here; the companion 30-min script computes its
// own live stop / position size for actual order placement.
// STEP F — Overall score: MT and 3Q category scores (0-10 each) are weighted
// (wMT/wQ, auto-normalized) and averaged into one 0-10 score. If the
// broader market is NOT aligned (Step D.b failed), the score is hard-capped
// (default 3) regardless of how good everything else looks — "go with the
// market, very little tolerance against it."
// STEP G — Optionally plots the Daily Fast/Mid/Slow SMAs (off by default — toggle in
// "Chart Display") and builds the dashboard table.
// =====================================================================================
Open-source Skript
Ganz im Sinne von TradingView hat dieser Autor sein/ihr Script als Open-Source veröffentlicht. Auf diese Weise können nun auch andere Trader das Script rezensieren und die Funktionalität überprüfen. Vielen Dank an den Autor! Sie können das Script kostenlos verwenden, aber eine Wiederveröffentlichung des Codes unterliegt unseren Hausregeln.

Haftungsausschluss
Die Informationen und Veröffentlichungen sind nicht als Finanz-, Anlage-, Handels- oder andere Arten von Ratschlägen oder Empfehlungen gedacht, die von TradingView bereitgestellt oder gebilligt werden, und stellen diese nicht dar. Lesen Sie mehr in den Nutzungsbedingungen.
Open-source Skript
Ganz im Sinne von TradingView hat dieser Autor sein/ihr Script als Open-Source veröffentlicht. Auf diese Weise können nun auch andere Trader das Script rezensieren und die Funktionalität überprüfen. Vielen Dank an den Autor! Sie können das Script kostenlos verwenden, aber eine Wiederveröffentlichung des Codes unterliegt unseren Hausregeln.
Haftungsausschluss
Die Informationen und Veröffentlichungen sind nicht als Finanz-, Anlage-, Handels- oder andere Arten von Ratschlägen oder Empfehlungen gedacht, die von TradingView bereitgestellt oder gebilligt werden, und stellen diese nicht dar. Lesen Sie mehr in den Nutzungsbedingungen.