OPEN-SOURCE SCRIPT
RSI Multi-Timeframe Dashboard
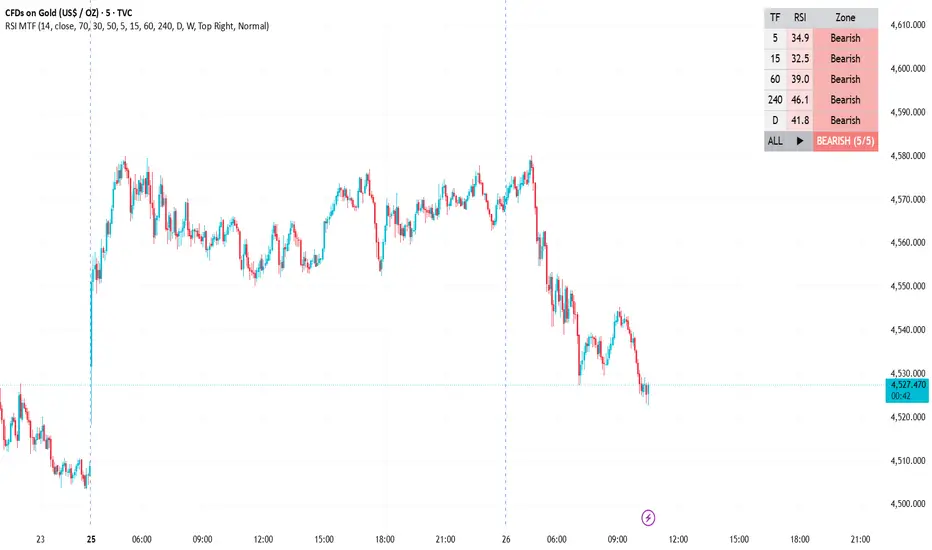
RSI Multi-Timeframe Dashboard
═══════════════════════════════════════════
WHAT IT DOES
═══════════════════════════════════════════
This tool displays the Relative Strength Index (RSI) of up to six timeframes
at once in a compact on-chart table, so you can judge momentum across the
whole timeframe stack without switching charts. Instead of reading RSI on a
single timeframe, you see how short-, medium- and higher-timeframe momentum
line up — and a consensus row summarises the overall picture.
It is designed as a CONFLUENCE tool: a way to see whether the broader market
agrees with what you're seeing on your trading timeframe.
═══════════════════════════════════════════
HOW IT WORKS
═══════════════════════════════════════════
RSI is calculated with the standard Wilder method (default length 14) on each
selected timeframe using request.security(). Each row is classified into a zone:
- Overbought — RSI at or above the overbought level (default 70)
- Oversold — RSI at or below the oversold level (default 30)
- Bullish — RSI above the midline (default 50)
- Bearish — RSI below the midline (default 50)
The "ALL" row aggregates only the enabled timeframes:
- If every enabled timeframe is oversold → "STRONG BUY ZONE"
- If every enabled timeframe is overbought → "STRONG SELL ZONE"
- Otherwise it shows the majority bias and a score, e.g. "BULLISH (4/5)"
These are descriptions of momentum conditions — not instructions to buy or sell.
═══════════════════════════════════════════
HOW TO USE IT IN A TRADE
═══════════════════════════════════════════
The core idea is alignment. Higher-timeframe RSI defines the bias; lower-timeframe
RSI helps with timing inside that bias.
Example long workflow:
1. Bias — Confirm the higher timeframes (e.g. 4H, Daily) are Bullish (above the
midline). This says the dominant momentum favours longs.
2. Timing — Wait for a lower timeframe (e.g. 5m/15m) to dip toward Oversold and
turn back up, offering a pullback entry in the direction of the higher-TF bias.
3. Confluence — A "BULLISH (5/5)" or rising consensus score adds conviction;
a "MIXED" reading is a reason to wait.
4. Management — Define your stop from price structure (recent swing), not from
RSI alone, and size the position to your own risk rules.
The short workflow is the mirror image (higher TFs Bearish, lower TF rallies into
Overbought and rolls over).
Things to respect:
- RSI can remain Overbought in a strong uptrend (and Oversold in a strong
downtrend) for a long time. "Overbought" is not automatically "sell."
- Counter-trend signals (e.g. Oversold while higher TFs are Bearish) are
lower-probability and best avoided or treated as scalps only.
- This indicator does not place trades, set stops, or manage risk for you.
═══════════════════════════════════════════
SETTINGS
═══════════════════════════════════════════
- RSI — length, source, and the overbought / oversold / midline levels.
- Timeframes to monitor — up to 6 slots, each with an on/off toggle and its own
timeframe. Set them equal to or higher than your chart timeframe.
- Style — table position, text size, and your own bullish / bearish colours.
═══════════════════════════════════════════
ALERTS
═══════════════════════════════════════════
- All timeframes oversold
- All timeframes overbought
- Consensus turned bullish (majority crossed above the midline)
- Consensus turned bearish (majority crossed below the midline)
═══════════════════════════════════════════
NOTES, REPAINTING & LIMITATIONS
═══════════════════════════════════════════
- Monitored timeframes should be greater than or equal to your chart timeframe;
requesting a lower timeframe is not meaningful.
- Repainting: values use lookahead_off, so a higher-timeframe RSI updates live
until that bar closes — this is intended for real-time reading. The reading on
a closed higher-TF bar is final.
- RSI is a momentum oscillator, not a forecast. This dashboard organises that
information across timeframes; it does not predict price.
This script is published open-source. Study it, learn from it, and adapt it to
your own process. It is provided for educational purposes only and is not
financial advice. Past behaviour of any indicator does not guarantee future
results — always do your own analysis and manage your risk.
═══════════════════════════════════════════
WHAT IT DOES
═══════════════════════════════════════════
This tool displays the Relative Strength Index (RSI) of up to six timeframes
at once in a compact on-chart table, so you can judge momentum across the
whole timeframe stack without switching charts. Instead of reading RSI on a
single timeframe, you see how short-, medium- and higher-timeframe momentum
line up — and a consensus row summarises the overall picture.
It is designed as a CONFLUENCE tool: a way to see whether the broader market
agrees with what you're seeing on your trading timeframe.
═══════════════════════════════════════════
HOW IT WORKS
═══════════════════════════════════════════
RSI is calculated with the standard Wilder method (default length 14) on each
selected timeframe using request.security(). Each row is classified into a zone:
- Overbought — RSI at or above the overbought level (default 70)
- Oversold — RSI at or below the oversold level (default 30)
- Bullish — RSI above the midline (default 50)
- Bearish — RSI below the midline (default 50)
The "ALL" row aggregates only the enabled timeframes:
- If every enabled timeframe is oversold → "STRONG BUY ZONE"
- If every enabled timeframe is overbought → "STRONG SELL ZONE"
- Otherwise it shows the majority bias and a score, e.g. "BULLISH (4/5)"
These are descriptions of momentum conditions — not instructions to buy or sell.
═══════════════════════════════════════════
HOW TO USE IT IN A TRADE
═══════════════════════════════════════════
The core idea is alignment. Higher-timeframe RSI defines the bias; lower-timeframe
RSI helps with timing inside that bias.
Example long workflow:
1. Bias — Confirm the higher timeframes (e.g. 4H, Daily) are Bullish (above the
midline). This says the dominant momentum favours longs.
2. Timing — Wait for a lower timeframe (e.g. 5m/15m) to dip toward Oversold and
turn back up, offering a pullback entry in the direction of the higher-TF bias.
3. Confluence — A "BULLISH (5/5)" or rising consensus score adds conviction;
a "MIXED" reading is a reason to wait.
4. Management — Define your stop from price structure (recent swing), not from
RSI alone, and size the position to your own risk rules.
The short workflow is the mirror image (higher TFs Bearish, lower TF rallies into
Overbought and rolls over).
Things to respect:
- RSI can remain Overbought in a strong uptrend (and Oversold in a strong
downtrend) for a long time. "Overbought" is not automatically "sell."
- Counter-trend signals (e.g. Oversold while higher TFs are Bearish) are
lower-probability and best avoided or treated as scalps only.
- This indicator does not place trades, set stops, or manage risk for you.
═══════════════════════════════════════════
SETTINGS
═══════════════════════════════════════════
- RSI — length, source, and the overbought / oversold / midline levels.
- Timeframes to monitor — up to 6 slots, each with an on/off toggle and its own
timeframe. Set them equal to or higher than your chart timeframe.
- Style — table position, text size, and your own bullish / bearish colours.
═══════════════════════════════════════════
ALERTS
═══════════════════════════════════════════
- All timeframes oversold
- All timeframes overbought
- Consensus turned bullish (majority crossed above the midline)
- Consensus turned bearish (majority crossed below the midline)
═══════════════════════════════════════════
NOTES, REPAINTING & LIMITATIONS
═══════════════════════════════════════════
- Monitored timeframes should be greater than or equal to your chart timeframe;
requesting a lower timeframe is not meaningful.
- Repainting: values use lookahead_off, so a higher-timeframe RSI updates live
until that bar closes — this is intended for real-time reading. The reading on
a closed higher-TF bar is final.
- RSI is a momentum oscillator, not a forecast. This dashboard organises that
information across timeframes; it does not predict price.
This script is published open-source. Study it, learn from it, and adapt it to
your own process. It is provided for educational purposes only and is not
financial advice. Past behaviour of any indicator does not guarantee future
results — always do your own analysis and manage your risk.
Open-source Skript
Ganz im Sinne von TradingView hat dieser Autor sein/ihr Script als Open-Source veröffentlicht. Auf diese Weise können nun auch andere Trader das Script rezensieren und die Funktionalität überprüfen. Vielen Dank an den Autor! Sie können das Script kostenlos verwenden, aber eine Wiederveröffentlichung des Codes unterliegt unseren Hausregeln.

Haftungsausschluss
Die Informationen und Veröffentlichungen sind nicht als Finanz-, Anlage-, Handels- oder andere Arten von Ratschlägen oder Empfehlungen gedacht, die von TradingView bereitgestellt oder gebilligt werden, und stellen diese nicht dar. Lesen Sie mehr in den Nutzungsbedingungen.
Open-source Skript
Ganz im Sinne von TradingView hat dieser Autor sein/ihr Script als Open-Source veröffentlicht. Auf diese Weise können nun auch andere Trader das Script rezensieren und die Funktionalität überprüfen. Vielen Dank an den Autor! Sie können das Script kostenlos verwenden, aber eine Wiederveröffentlichung des Codes unterliegt unseren Hausregeln.
Haftungsausschluss
Die Informationen und Veröffentlichungen sind nicht als Finanz-, Anlage-, Handels- oder andere Arten von Ratschlägen oder Empfehlungen gedacht, die von TradingView bereitgestellt oder gebilligt werden, und stellen diese nicht dar. Lesen Sie mehr in den Nutzungsbedingungen.