RSI Triangle Detector
RSI Triangle Detector
OVERVIEW
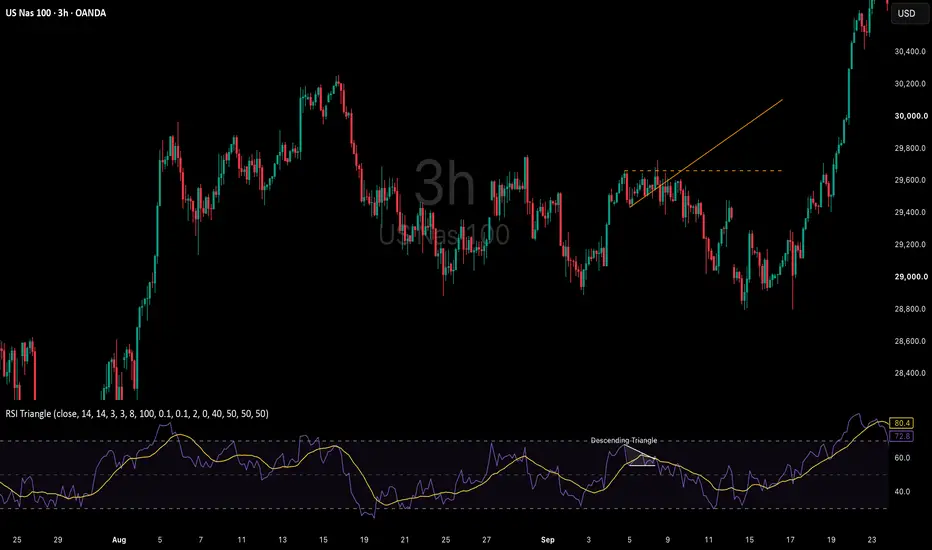
This indicator automatically finds triangle patterns that form on the RSI itself, not on price. When the RSI later breaks out of the triangle, it marks the breakout bar on the price chart and draws the key price levels of the consolidation, so you can see at a glance where momentum was compressing and where it was released.
It is designed as a tool to support your own analysis. It does not provide entry or exit signals on its own.
HOW IT WORKS
1. Pivot detection
The script tracks the two most recent pivot highs and the two most recent pivot lows of the RSI. The upper line of the triangle connects the two highs, and the lower line connects the two lows.
2. Triangle conditions
A triangle is recognized only when all of the following are true:
- The upper line is flat or falling, and the lower line is flat or rising (within the slope tolerance).
- The two lines converge at least at the minimum rate you set.
- The width of the pattern is within the minimum and maximum number of bars.
- The highs and lows overlap in time, so the lines actually enclose the RSI.
- The RSI has stayed between the two lines from the start of the pattern to the current bar (a small overshoot is allowed).
3. Optional filters
- Midline filter: only triangles sitting entirely above or entirely below the midline (default 50) are used.
- Direction filter: above the midline, the upper line must be flat or falling. Below the midline, the lower line must be flat or rising.
4. Breakout
Once a triangle is formed, both lines are extended bar by bar. A breakout is confirmed when the RSI closes above the upper line or below the lower line. The pattern is discarded if the lines meet at the apex or if no breakout happens within the waiting period.
WHAT YOU SEE
In the RSI pane:
- The RSI and its moving average
- The triangle (two lines with a shaded area) and its type: Ascending, Descending, or Symmetrical
On the price chart:
- A "Break Up" or "Break Down" label on the breakout bar
- For triangles above the midline: a dashed horizontal line at the highest price of the consolidation, and a trendline connecting the price lows at the RSI pivot lows
- For triangles below the midline: a dashed horizontal line at the lowest price of the consolidation, and a trendline connecting the price highs at the RSI pivot highs
- These lines are extended to the right for a set number of bars after the breakout
HOW TO USE
- Treat a breakout as a sign that momentum has left a period of compression. Check it against your own view of trend, structure, and support and resistance.
- The horizontal line and trendline show the price range that corresponded to the RSI triangle. Watching how price reacts to these levels after the breakout can help you judge whether the move has follow-through.
- If too many or too few patterns appear, adjust the pivot bars, the minimum convergence, and the width settings first.
MAIN SETTINGS
- RSI Length / MA Length
- Pivot Left Bars / Pivot Right Bars: sensitivity of the pivot highs and lows
- Min / Max Triangle Width: allowed size of the pattern in bars
- Flat Slope Tolerance: how much slope is still treated as flat
- Min Convergence: how quickly the two lines must approach each other
- Line Overshoot Tolerance: how far the RSI may exceed the lines while the pattern forms
- Breakout Buffer: extra distance required to confirm a breakout
- Bars to Wait for Breakout: how long a formed triangle stays valid
- Midline and direction filters
- Chart display: lines, labels, number of line sets to keep, extension length, colors
ALERTS
- Triangle Formed
- Triangle Breakout Up
- Triangle Breakout Down
NOTES
- All conditions are evaluated on confirmed bars, so signals do not change after the bar closes.
- Pivots need the "right bars" to be confirmed, so a triangle appears a few bars after its last pivot.
- Not every breakout leads to a sustained move. Results vary by symbol and timeframe, so please check recent signals on the chart you trade before relying on them.
- This script is for informational purposes only and is not financial advice.
――――――――――――――――――――
日本語版 (Japanese)
――――――――――――――――――――
RSI Triangle Detector(RSI 三角持ち合い判定)
概要
このインジケーターは、価格ではなくRSIそのものにできる三角持ち合いを自動で見つけます。その後RSIが三角形を抜けると、価格チャート上の抜けた足に印をつけ、持ち合い期間の重要な価格水準を線で示します。勢いがどこでたまり、どこで放たれたのかをひと目で確認できます。
ご自身の分析を助けるための道具であり、これだけで売買の合図を出すものではありません。
仕組み
1. 山と谷の検出
RSIの直近2つの山と直近2つの谷を記録します。三角形の上の線は2つの山を、下の線は2つの谷を結んだものです。
2. 三角形の条件
次の条件をすべて満たしたときだけ、三角形と判定します。
- 上の線が水平か右下がり、下の線が水平か右上がりであること(傾きの許容幅の範囲内)
- 2本の線が、設定した最小の速さ以上でせばまっていること
- 形の幅が、最小と最大の本数の範囲に収まっていること
- 山と谷の期間が重なっていて、2本の線が実際にRSIをはさんでいること
- 形の始まりから現在の足まで、RSIが2本の線の間に収まっていること(わずかなはみ出しは許容)
3. 任意の絞りこみ
- 中央の線による絞りこみ: 全体が中央の線(初期値50)より上、または下に収まっている三角形だけを使います。
- 線の向きによる絞りこみ: 中央の線より上では、上の線が水平か右下がりのものだけ。中央の線より下では、下の線が水平か右上がりのものだけを使います。
4. ブレイク
三角形ができると、2本の線を1本ごとに延ばしていきます。RSIの終値が上の線を上回るか、下の線を下回ったときにブレイクと判定します。2本の線が頂点で交わった場合や、待つ本数のうちに抜けなかった場合は、その形を取り消します。
表示されるもの
RSIの画面:
- RSIとその移動平均
- 三角形(2本の線と塗りつぶし)とその種類(Ascending=上昇三角、Descending=下降三角、Symmetrical=対称三角)
価格チャート:
- 抜けた足に「Break Up」(上抜け)または「Break Down」(下抜け)の吹き出し
- 中央の線より上の三角形: 持ち合い期間の高値に破線の水平線、RSIの谷にあたる足の安値どうしを結ぶトレンドライン
- 中央の線より下の三角形: 持ち合い期間の安値に破線の水平線、RSIの山にあたる足の高値どうしを結ぶトレンドライン
- これらの線は、抜けたあとも設定した本数だけ右へ延びます
使い方
- ブレイクは、たまっていた勢いが動きだした合図としてとらえ、トレンドや値動きの形、支持線・抵抗線についてのご自身の見立てと照らし合わせてください。
- 水平線とトレンドラインは、RSIの三角形に対応する価格の範囲を示します。抜けたあとに価格がこれらの水準でどう反応するかを見ると、動きが続くかどうかを判断する助けになります。
- 形が多すぎる、または少なすぎる場合は、まず山・谷の判定本数、最小のせばまり方、幅の設定を調整してください。
主な設定
- RSI Length / MA Length: RSIの期間 / 移動平均の期間
- Pivot Left Bars / Pivot Right Bars: 山と谷を判定する感度
- Min / Max Triangle Width: 形として認める幅(本数)
- Flat Slope Tolerance: 水平とみなす傾きの幅
- Min Convergence: 2本の線がせばまる速さの最小値
- Line Overshoot Tolerance: 形ができるまでの間に許すRSIのはみ出し
- Breakout Buffer: ブレイクと判定するために必要な余裕
- Bars to Wait for Breakout: できた三角形を有効とする本数
- 中央の線と線の向きによる絞りこみ
- チャート上の表示: 線、吹き出し、残す線の組数、延ばす本数、色
アラート
- Triangle Formed: 三角持ち合いの形成
- Triangle Breakout Up: 上抜け
- Triangle Breakout Down: 下抜け
注意点
- すべての条件は確定した足で判定するため、足が確定したあとに合図が変わることはありません。
- 山と谷は右側の本数がそろって初めて確定するため、三角形は最後の山または谷から数本遅れて表示されます。
- ブレイクのあとに必ず大きな動きが続くわけではありません。結果は銘柄や時間足によって変わるため、実際に使うチャートで直近の合図を確かめてからご利用ください。
- このスクリプトは情報提供を目的としたものであり、投資の助言ではありません。
OVERVIEW
This indicator automatically finds triangle patterns that form on the RSI itself, not on price. When the RSI later breaks out of the triangle, it marks the breakout bar on the price chart and draws the key price levels of the consolidation, so you can see at a glance where momentum was compressing and where it was released.
It is designed as a tool to support your own analysis. It does not provide entry or exit signals on its own.
HOW IT WORKS
1. Pivot detection
The script tracks the two most recent pivot highs and the two most recent pivot lows of the RSI. The upper line of the triangle connects the two highs, and the lower line connects the two lows.
2. Triangle conditions
A triangle is recognized only when all of the following are true:
- The upper line is flat or falling, and the lower line is flat or rising (within the slope tolerance).
- The two lines converge at least at the minimum rate you set.
- The width of the pattern is within the minimum and maximum number of bars.
- The highs and lows overlap in time, so the lines actually enclose the RSI.
- The RSI has stayed between the two lines from the start of the pattern to the current bar (a small overshoot is allowed).
3. Optional filters
- Midline filter: only triangles sitting entirely above or entirely below the midline (default 50) are used.
- Direction filter: above the midline, the upper line must be flat or falling. Below the midline, the lower line must be flat or rising.
4. Breakout
Once a triangle is formed, both lines are extended bar by bar. A breakout is confirmed when the RSI closes above the upper line or below the lower line. The pattern is discarded if the lines meet at the apex or if no breakout happens within the waiting period.
WHAT YOU SEE
In the RSI pane:
- The RSI and its moving average
- The triangle (two lines with a shaded area) and its type: Ascending, Descending, or Symmetrical
On the price chart:
- A "Break Up" or "Break Down" label on the breakout bar
- For triangles above the midline: a dashed horizontal line at the highest price of the consolidation, and a trendline connecting the price lows at the RSI pivot lows
- For triangles below the midline: a dashed horizontal line at the lowest price of the consolidation, and a trendline connecting the price highs at the RSI pivot highs
- These lines are extended to the right for a set number of bars after the breakout
HOW TO USE
- Treat a breakout as a sign that momentum has left a period of compression. Check it against your own view of trend, structure, and support and resistance.
- The horizontal line and trendline show the price range that corresponded to the RSI triangle. Watching how price reacts to these levels after the breakout can help you judge whether the move has follow-through.
- If too many or too few patterns appear, adjust the pivot bars, the minimum convergence, and the width settings first.
MAIN SETTINGS
- RSI Length / MA Length
- Pivot Left Bars / Pivot Right Bars: sensitivity of the pivot highs and lows
- Min / Max Triangle Width: allowed size of the pattern in bars
- Flat Slope Tolerance: how much slope is still treated as flat
- Min Convergence: how quickly the two lines must approach each other
- Line Overshoot Tolerance: how far the RSI may exceed the lines while the pattern forms
- Breakout Buffer: extra distance required to confirm a breakout
- Bars to Wait for Breakout: how long a formed triangle stays valid
- Midline and direction filters
- Chart display: lines, labels, number of line sets to keep, extension length, colors
ALERTS
- Triangle Formed
- Triangle Breakout Up
- Triangle Breakout Down
NOTES
- All conditions are evaluated on confirmed bars, so signals do not change after the bar closes.
- Pivots need the "right bars" to be confirmed, so a triangle appears a few bars after its last pivot.
- Not every breakout leads to a sustained move. Results vary by symbol and timeframe, so please check recent signals on the chart you trade before relying on them.
- This script is for informational purposes only and is not financial advice.
――――――――――――――――――――
日本語版 (Japanese)
――――――――――――――――――――
RSI Triangle Detector(RSI 三角持ち合い判定)
概要
このインジケーターは、価格ではなくRSIそのものにできる三角持ち合いを自動で見つけます。その後RSIが三角形を抜けると、価格チャート上の抜けた足に印をつけ、持ち合い期間の重要な価格水準を線で示します。勢いがどこでたまり、どこで放たれたのかをひと目で確認できます。
ご自身の分析を助けるための道具であり、これだけで売買の合図を出すものではありません。
仕組み
1. 山と谷の検出
RSIの直近2つの山と直近2つの谷を記録します。三角形の上の線は2つの山を、下の線は2つの谷を結んだものです。
2. 三角形の条件
次の条件をすべて満たしたときだけ、三角形と判定します。
- 上の線が水平か右下がり、下の線が水平か右上がりであること(傾きの許容幅の範囲内)
- 2本の線が、設定した最小の速さ以上でせばまっていること
- 形の幅が、最小と最大の本数の範囲に収まっていること
- 山と谷の期間が重なっていて、2本の線が実際にRSIをはさんでいること
- 形の始まりから現在の足まで、RSIが2本の線の間に収まっていること(わずかなはみ出しは許容)
3. 任意の絞りこみ
- 中央の線による絞りこみ: 全体が中央の線(初期値50)より上、または下に収まっている三角形だけを使います。
- 線の向きによる絞りこみ: 中央の線より上では、上の線が水平か右下がりのものだけ。中央の線より下では、下の線が水平か右上がりのものだけを使います。
4. ブレイク
三角形ができると、2本の線を1本ごとに延ばしていきます。RSIの終値が上の線を上回るか、下の線を下回ったときにブレイクと判定します。2本の線が頂点で交わった場合や、待つ本数のうちに抜けなかった場合は、その形を取り消します。
表示されるもの
RSIの画面:
- RSIとその移動平均
- 三角形(2本の線と塗りつぶし)とその種類(Ascending=上昇三角、Descending=下降三角、Symmetrical=対称三角)
価格チャート:
- 抜けた足に「Break Up」(上抜け)または「Break Down」(下抜け)の吹き出し
- 中央の線より上の三角形: 持ち合い期間の高値に破線の水平線、RSIの谷にあたる足の安値どうしを結ぶトレンドライン
- 中央の線より下の三角形: 持ち合い期間の安値に破線の水平線、RSIの山にあたる足の高値どうしを結ぶトレンドライン
- これらの線は、抜けたあとも設定した本数だけ右へ延びます
使い方
- ブレイクは、たまっていた勢いが動きだした合図としてとらえ、トレンドや値動きの形、支持線・抵抗線についてのご自身の見立てと照らし合わせてください。
- 水平線とトレンドラインは、RSIの三角形に対応する価格の範囲を示します。抜けたあとに価格がこれらの水準でどう反応するかを見ると、動きが続くかどうかを判断する助けになります。
- 形が多すぎる、または少なすぎる場合は、まず山・谷の判定本数、最小のせばまり方、幅の設定を調整してください。
主な設定
- RSI Length / MA Length: RSIの期間 / 移動平均の期間
- Pivot Left Bars / Pivot Right Bars: 山と谷を判定する感度
- Min / Max Triangle Width: 形として認める幅(本数)
- Flat Slope Tolerance: 水平とみなす傾きの幅
- Min Convergence: 2本の線がせばまる速さの最小値
- Line Overshoot Tolerance: 形ができるまでの間に許すRSIのはみ出し
- Breakout Buffer: ブレイクと判定するために必要な余裕
- Bars to Wait for Breakout: できた三角形を有効とする本数
- 中央の線と線の向きによる絞りこみ
- チャート上の表示: 線、吹き出し、残す線の組数、延ばす本数、色
アラート
- Triangle Formed: 三角持ち合いの形成
- Triangle Breakout Up: 上抜け
- Triangle Breakout Down: 下抜け
注意点
- すべての条件は確定した足で判定するため、足が確定したあとに合図が変わることはありません。
- 山と谷は右側の本数がそろって初めて確定するため、三角形は最後の山または谷から数本遅れて表示されます。
- ブレイクのあとに必ず大きな動きが続くわけではありません。結果は銘柄や時間足によって変わるため、実際に使うチャートで直近の合図を確かめてからご利用ください。
- このスクリプトは情報提供を目的としたものであり、投資の助言ではありません。

Haftungsausschluss
Die Informationen und Veröffentlichungen sind nicht als Finanz-, Anlage-, Handels- oder andere Arten von Ratschlägen oder Empfehlungen gedacht, die von TradingView bereitgestellt oder gebilligt werden, und stellen diese nicht dar. Lesen Sie mehr in den Nutzungsbedingungen.
Haftungsausschluss
Die Informationen und Veröffentlichungen sind nicht als Finanz-, Anlage-, Handels- oder andere Arten von Ratschlägen oder Empfehlungen gedacht, die von TradingView bereitgestellt oder gebilligt werden, und stellen diese nicht dar. Lesen Sie mehr in den Nutzungsbedingungen.