XAUUSD Stochastic Buy and Sell Signals
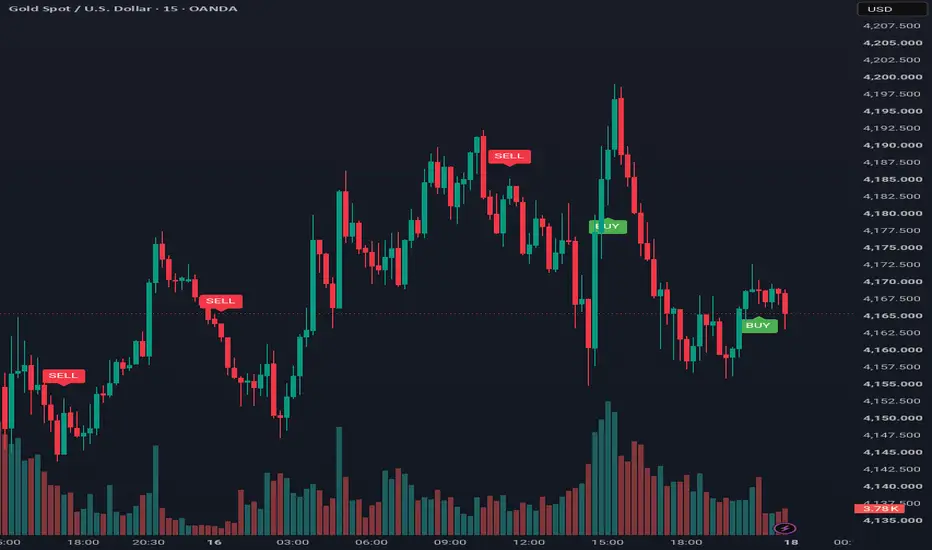
XAUUSD Stochastic Buy and Sell Signals is a simple momentum indicator that prints BUY and SELL labels on the price chart when the Stochastic %K line leaves the neutral 50 area with some conviction.
How it works
The script calculates a standard Stochastic %K from close, high and low over the "Stochastic Length" (default 14) and smooths it with a simple moving average of "Smooth K" bars (default 5). Two threshold lines define the entries: "Buy Entry Line" (default 55) and "Sell Entry Line" (default 45).
- A BUY label appears below the bar when %K crosses above the buy line and the previous %K value was below 50. This means momentum moved from the lower half of the range into the upper half in one step.
- A SELL label appears above the bar when %K crosses below the sell line and the previous %K value was above 50.
Requiring the prior value to be on the other side of 50 filters out small wiggles around the threshold lines. Only labels are drawn; there are no other plots.
How to use it
Add the script to a gold (XAUUSD) chart. It was designed for intraday charts such as 5, 15 and 60 minutes, but the logic works on any symbol and timeframe. Treat a label as a momentum shift, then confirm it with your own trend reading, support and resistance and risk management. Widening the gap between the two lines (for example 60/40) gives fewer, later signals; narrowing it gives more, earlier signals.
Limitations
Signals are evaluated on each bar and can appear and disappear while the bar is still open; use bar close for confirmation. In sideways markets the Stochastic crosses 50 often, so expect many signals that do not follow through. The script has no stop-loss, take-profit or exit logic and no alerts.
For educational purposes. Not financial advice.
How it works
The script calculates a standard Stochastic %K from close, high and low over the "Stochastic Length" (default 14) and smooths it with a simple moving average of "Smooth K" bars (default 5). Two threshold lines define the entries: "Buy Entry Line" (default 55) and "Sell Entry Line" (default 45).
- A BUY label appears below the bar when %K crosses above the buy line and the previous %K value was below 50. This means momentum moved from the lower half of the range into the upper half in one step.
- A SELL label appears above the bar when %K crosses below the sell line and the previous %K value was above 50.
Requiring the prior value to be on the other side of 50 filters out small wiggles around the threshold lines. Only labels are drawn; there are no other plots.
How to use it
Add the script to a gold (XAUUSD) chart. It was designed for intraday charts such as 5, 15 and 60 minutes, but the logic works on any symbol and timeframe. Treat a label as a momentum shift, then confirm it with your own trend reading, support and resistance and risk management. Widening the gap between the two lines (for example 60/40) gives fewer, later signals; narrowing it gives more, earlier signals.
Limitations
Signals are evaluated on each bar and can appear and disappear while the bar is still open; use bar close for confirmation. In sideways markets the Stochastic crosses 50 often, so expect many signals that do not follow through. The script has no stop-loss, take-profit or exit logic and no alerts.
For educational purposes. Not financial advice.

Haftungsausschluss
Die Informationen und Veröffentlichungen sind nicht als Finanz-, Anlage-, Handels- oder andere Arten von Ratschlägen oder Empfehlungen gedacht, die von TradingView bereitgestellt oder gebilligt werden, und stellen diese nicht dar. Lesen Sie mehr in den Nutzungsbedingungen.
Haftungsausschluss
Die Informationen und Veröffentlichungen sind nicht als Finanz-, Anlage-, Handels- oder andere Arten von Ratschlägen oder Empfehlungen gedacht, die von TradingView bereitgestellt oder gebilligt werden, und stellen diese nicht dar. Lesen Sie mehr in den Nutzungsbedingungen.