OPEN-SOURCE SCRIPT
Aktualisiert Gann Semicircles Time Projections | Astral Vision
Gann Semicircles Time Projections | Astral Vision 🌠💠
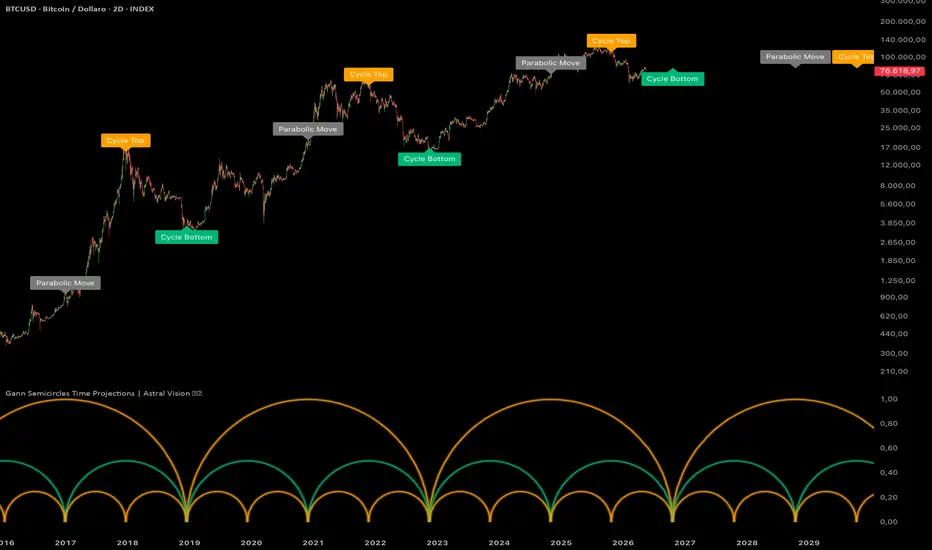
This indicator projects Bitcoin's market cycle structure forward in time using a geometric framework based on W.D. Gann's semicircle theory, which treats time as the primary axis of market analysis. The core premise is that significant market cycles repeat in proportional time intervals, and that within each cycle the key inflection points (the parabolic acceleration phase, the cycle top, and the cycle bottom) occur at geometrically predictable subdivisions of the total cycle duration.
Calculation ⚙️
The model is anchored to two historically significant Bitcoin cycle bottoms: January 14, 2015 and December 16, 2018. The distance in bars between these two anchors defines the base cycle length R. This cycle is then projected forward three times from the second anchor, producing four complete cycles in total: one historical (2015 to 2018), and three projected forward from 2018 onward.
Within each cycle of length R, the indicator draws a hierarchy of semicircles at three levels of subdivision. The first level draws a single large semicircle spanning the full cycle length R with a peak height of 1.0. The second level splits the cycle at the midpoint R/2 and draws two semicircles each with half the peak height, marking the parabolic acceleration zone at the cycle midpoint. The third level splits each half further into quarters R/4 and draws four smaller semicircles each with one quarter of the peak height, marking the early and late phases of each sub-cycle.
Each semicircle is constructed by computing 101 points distributed along a sine curve. For each point at position i from 0 to 100, the horizontal fraction along the cycle is computed as (1 - cos(π × i/100)) / 2, which produces a smooth non-linear distribution that accelerates toward the center and decelerates at the edges. The vertical coordinate at each point is sin(π × i/100) multiplied by the peak height. This produces a true geometric semicircle in the time-price space of the sub-panel.
The key time projections within each cycle are: the cycle top, placed at the three-quarter mark of the cycle (R × 3/4 from the cycle start), the parabolic move marker at the midpoint (R/2), and the cycle bottom at the end of the cycle (R). Each projection is labeled directly on the price chart at the high of the nearest historical bar, or at the last available high for future projections.
Each semicircle is rendered with three layered polylines at decreasing transparency and increasing line width to create a glow effect.
Plots 📊
Inputs 🎛️
Colors 🎨
5 Astral Vision presets + custom override. Default: Hermes.
Purpose 🎯
Standard cycle indicators use fixed bar counts or calendar-based periodicity, which do not adapt to the proportional structure of each individual cycle. This indicator derives its forward projections entirely from the geometry of the two anchor points, meaning the projected cycle length is empirically grounded in Bitcoin's own historical behavior rather than imposed from outside. The three-level semicircle hierarchy provides a visual map of the entire cycle structure simultaneously, making it possible to identify not just when a top or bottom might occur but also the parabolic acceleration zone that precedes it, which is absent from linear cycle tools.
Disclaimer ⭕️
This indicator is for informational and educational purposes only. It does not constitute financial advice. Past performance is not indicative of future results. Always do your own research before making investment decisions.
This indicator projects Bitcoin's market cycle structure forward in time using a geometric framework based on W.D. Gann's semicircle theory, which treats time as the primary axis of market analysis. The core premise is that significant market cycles repeat in proportional time intervals, and that within each cycle the key inflection points (the parabolic acceleration phase, the cycle top, and the cycle bottom) occur at geometrically predictable subdivisions of the total cycle duration.
Calculation ⚙️
The model is anchored to two historically significant Bitcoin cycle bottoms: January 14, 2015 and December 16, 2018. The distance in bars between these two anchors defines the base cycle length R. This cycle is then projected forward three times from the second anchor, producing four complete cycles in total: one historical (2015 to 2018), and three projected forward from 2018 onward.
Within each cycle of length R, the indicator draws a hierarchy of semicircles at three levels of subdivision. The first level draws a single large semicircle spanning the full cycle length R with a peak height of 1.0. The second level splits the cycle at the midpoint R/2 and draws two semicircles each with half the peak height, marking the parabolic acceleration zone at the cycle midpoint. The third level splits each half further into quarters R/4 and draws four smaller semicircles each with one quarter of the peak height, marking the early and late phases of each sub-cycle.
Each semicircle is constructed by computing 101 points distributed along a sine curve. For each point at position i from 0 to 100, the horizontal fraction along the cycle is computed as (1 - cos(π × i/100)) / 2, which produces a smooth non-linear distribution that accelerates toward the center and decelerates at the edges. The vertical coordinate at each point is sin(π × i/100) multiplied by the peak height. This produces a true geometric semicircle in the time-price space of the sub-panel.
The key time projections within each cycle are: the cycle top, placed at the three-quarter mark of the cycle (R × 3/4 from the cycle start), the parabolic move marker at the midpoint (R/2), and the cycle bottom at the end of the cycle (R). Each projection is labeled directly on the price chart at the high of the nearest historical bar, or at the last available high for future projections.
Each semicircle is rendered with three layered polylines at decreasing transparency and increasing line width to create a glow effect.
Plots 📊
- Full-cycle semicircle spanning each complete cycle period, colored with the positive theme color
- Two half-cycle semicircles at R/2 subdivision, colored with the negative theme color
- Four quarter-cycle semicircles at R/4 subdivision, colored with the positive theme color
- All semicircles rendered with a three-layer glow effect
- Labels on the price chart marking Cycle Top, Parabolic Move, and Cycle Bottom at each key time projection
Inputs 🎛️
- No period or length inputs: the cycle structure is fully derived from the two fixed historical anchors
Colors 🎨
5 Astral Vision presets + custom override. Default: Hermes.
Purpose 🎯
Standard cycle indicators use fixed bar counts or calendar-based periodicity, which do not adapt to the proportional structure of each individual cycle. This indicator derives its forward projections entirely from the geometry of the two anchor points, meaning the projected cycle length is empirically grounded in Bitcoin's own historical behavior rather than imposed from outside. The three-level semicircle hierarchy provides a visual map of the entire cycle structure simultaneously, making it possible to identify not just when a top or bottom might occur but also the parabolic acceleration zone that precedes it, which is absent from linear cycle tools.
Disclaimer ⭕️
This indicator is for informational and educational purposes only. It does not constitute financial advice. Past performance is not indicative of future results. Always do your own research before making investment decisions.
Versionshinweise
Added anchor points as inputs so that users can plot the chart on different assets with different semicircles lengths.The standard configuration is valuable only on Bitcoin chart and won't load if the chart doesn't display data from 2015 backwards.
Open-source Skript
Ganz im Sinne von TradingView hat dieser Autor sein/ihr Script als Open-Source veröffentlicht. Auf diese Weise können nun auch andere Trader das Script rezensieren und die Funktionalität überprüfen. Vielen Dank an den Autor! Sie können das Script kostenlos verwenden, aber eine Wiederveröffentlichung des Codes unterliegt unseren Hausregeln.

My premium indicators are available on Whop:
whop.com/astralvision
Astral Vision 🌠💠
whop.com/astralvision
Astral Vision 🌠💠
Haftungsausschluss
Die Informationen und Veröffentlichungen sind nicht als Finanz-, Anlage-, Handels- oder andere Arten von Ratschlägen oder Empfehlungen gedacht, die von TradingView bereitgestellt oder gebilligt werden, und stellen diese nicht dar. Lesen Sie mehr in den Nutzungsbedingungen.
Open-source Skript
Ganz im Sinne von TradingView hat dieser Autor sein/ihr Script als Open-Source veröffentlicht. Auf diese Weise können nun auch andere Trader das Script rezensieren und die Funktionalität überprüfen. Vielen Dank an den Autor! Sie können das Script kostenlos verwenden, aber eine Wiederveröffentlichung des Codes unterliegt unseren Hausregeln.
My premium indicators are available on Whop:
whop.com/astralvision
Astral Vision 🌠💠
whop.com/astralvision
Astral Vision 🌠💠
Haftungsausschluss
Die Informationen und Veröffentlichungen sind nicht als Finanz-, Anlage-, Handels- oder andere Arten von Ratschlägen oder Empfehlungen gedacht, die von TradingView bereitgestellt oder gebilligt werden, und stellen diese nicht dar. Lesen Sie mehr in den Nutzungsbedingungen.