OPEN-SOURCE SCRIPT
Heatmap VWAP Profile [ChartPrime]
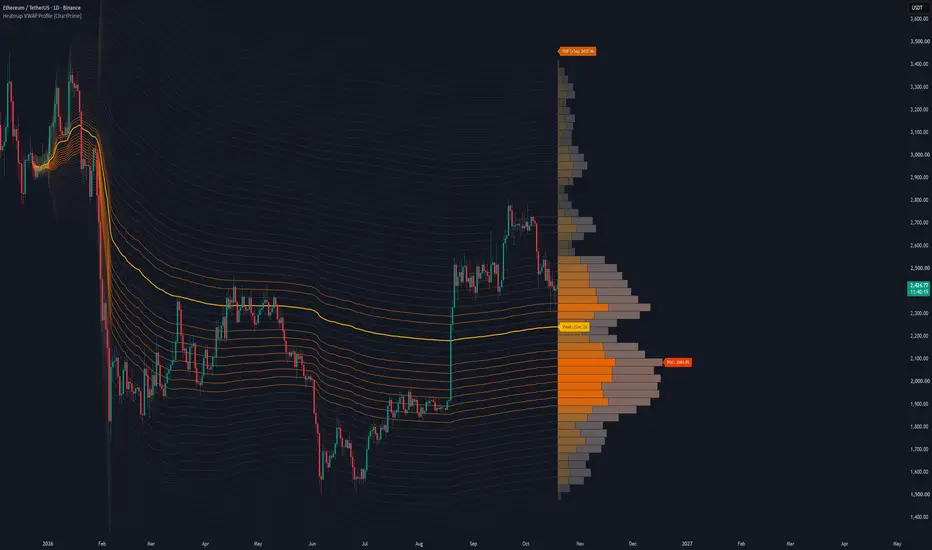
🔶 OVERVIEW
The Heatmap VWAP Profile [ChartPrime] indicator merges anchored Volume Weighted Average Price (VWAP) bands with an advanced heatmap volume profile. By projecting standard deviation channels forward from a user-defined anchor point and filling them with volume-weighted color gradients, it helps you visualize high-volume nodes (HVNs), low-volume nodes (LVNs), and the Point of Control (POC) directly on your chart.
🔶 HOW IT WORKS
The indicator operates through a multi-step analytical engine:
🔶 KEY FEATURES
🔶 TRADING APPLICATIONS
🔶 SETTINGS
🔶 CONCLUSION
The Heatmap VWAP Profile [ChartPrime] brings institutional order-flow visualization to your workspace. By combining anchored VWAP geometry with dynamic volume heatmaps, it gives you a clear visual edge in locating structural liquidity.
The Heatmap VWAP Profile [ChartPrime] indicator merges anchored Volume Weighted Average Price (VWAP) bands with an advanced heatmap volume profile. By projecting standard deviation channels forward from a user-defined anchor point and filling them with volume-weighted color gradients, it helps you visualize high-volume nodes (HVNs), low-volume nodes (LVNs), and the Point of Control (POC) directly on your chart.
🔶 HOW IT WORKS
The indicator operates through a multi-step analytical engine:
- Anchored VWAP Engine: Calculates cumulative price-volume action and standard deviation spread starting from a configurable lookback anchor bar.
- Dynamic Polyline Bands: Projects upper and lower standard deviation channels forward across the historical chart range.
- Volume Profile Binning: Maps up-volume and down-volume distribution across custom price rows between the outer deviation boundaries.
- Heatmap Gradient Transparency: Applies dynamic opacity and color palettes based on volume density to highlight key institutional trading zones.
🔶 KEY FEATURES
- Interactive Volume Profile Boxes: Renders side-by-side up and down volume nodes scaled to match active liquidity distribution.
- Heatmap Polylines: Connects standard deviation bands with gradient coloring and varying styles depending on volume magnitude.
- Point of Control (POC) Tracking: Automatically identifies and labels the exact price row holding the highest volume concentration.
- Custom Label Styling: Displays dedicated price tags for VWAP, the POC, and the upper/lower deviation boundaries.
🔶 TRADING APPLICATIONS
- Support & Resistance Mapping: Use high-volume nodes and the POC as natural magnet levels for price reversals or range boundaries.
- Volume Imbalance Detection: Look for low-volume nodes (LVNs) to identify areas where price may move rapidly due to a lack of resting liquidity.
- VWAP Trend Confluence: Gauge overall market bias and volatility expansion using the anchored VWAP baseline and its outer standard deviation bands.
🔶 SETTINGS
- Anchor & Band Settings: Controls lookback bar depth, polyline visibility, and the maximum standard deviation multiplier.
- Volume Profile Settings: Adjusts row counts and maximum profile width dimensions on the chart.
- Label Settings: Toggles price tag visibility and customizes label background and text colors.
- Color & Opacity Controls: Customizes the gold-and-bronze color palettes alongside transparency thresholds for high and low volume nodes.
🔶 CONCLUSION
The Heatmap VWAP Profile [ChartPrime] brings institutional order-flow visualization to your workspace. By combining anchored VWAP geometry with dynamic volume heatmaps, it gives you a clear visual edge in locating structural liquidity.
Open-source Skript
Ganz im Sinne von TradingView hat dieser Autor sein/ihr Script als Open-Source veröffentlicht. Auf diese Weise können nun auch andere Trader das Script rezensieren und die Funktionalität überprüfen. Vielen Dank an den Autor! Sie können das Script kostenlos verwenden, aber eine Wiederveröffentlichung des Codes unterliegt unseren Hausregeln.

Haftungsausschluss
Die Informationen und Veröffentlichungen sind nicht als Finanz-, Anlage-, Handels- oder andere Arten von Ratschlägen oder Empfehlungen gedacht, die von TradingView bereitgestellt oder gebilligt werden, und stellen diese nicht dar. Lesen Sie mehr in den Nutzungsbedingungen.
Open-source Skript
Ganz im Sinne von TradingView hat dieser Autor sein/ihr Script als Open-Source veröffentlicht. Auf diese Weise können nun auch andere Trader das Script rezensieren und die Funktionalität überprüfen. Vielen Dank an den Autor! Sie können das Script kostenlos verwenden, aber eine Wiederveröffentlichung des Codes unterliegt unseren Hausregeln.
Haftungsausschluss
Die Informationen und Veröffentlichungen sind nicht als Finanz-, Anlage-, Handels- oder andere Arten von Ratschlägen oder Empfehlungen gedacht, die von TradingView bereitgestellt oder gebilligt werden, und stellen diese nicht dar. Lesen Sie mehr in den Nutzungsbedingungen.