Viprasol Wyckoff Schematic
🔵 OVERVIEW
🔵 WHY EVENTS, PHASES AND STRUCTURE ARE COMBINED
🔵 WHAT IS ORIGINAL
🔵 HOW IT WORKS
🔵 KEY FEATURES
🔵 HOW TO USE
🔵 SETTINGS
🔵 ALERTS
🔵 LIMITATIONS & DISCLAIMER
🔵 HOUSE RULES & PURPOSE
Published open-source by Viprasol.
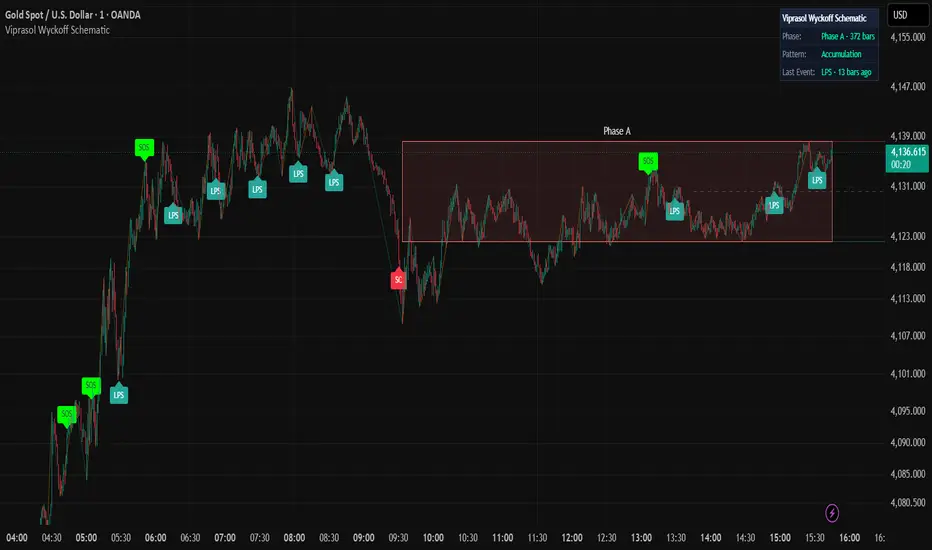
Viprasol Wyckoff Schematic is an automated, rule-based approximation of the Wyckoff method. It marks candidate Wyckoff events: Selling Climax, Automatic Rally, Spring, Sign of Strength and Last Point of Support on the accumulation side, and Buying Climax, UTAD and Last Point of Supply on the distribution side. It tracks the phase (A to E) those events point to, and draws the trading range, a zigzag of confirmed swings and an optional mini daily view of the current month. Each Spring and UTAD is followed up, and one that fails is marked as failed. A dashboard shows the current phase, its age and the last event.
Wyckoff analysts read a whole structure with judgement. This indicator applies fixed volume and price rules bar by bar, so treat every label as a candidate to check on the chart, not a confirmed event. It is built for traders who study accumulation and distribution and want the candidate events marked, spaced and followed up in one place.
🔵 WHY EVENTS, PHASES AND STRUCTURE ARE COMBINED
- Wyckoff is a volume-and-range method. Each event is defined by where price sits in the trading range and by how much volume (effort) produced how much price movement (result). The range lines, the volume rules and the event labels describe the same structure, so they belong on one chart.
- A phase is a sequence of events. A climax opens Phase A, the automatic rally starts Phase B, a test of the climax low opens Phase C, a sign of strength starts Phase D and the last point of support leads into Phase E. The phase engine reads the raw event conditions on every closed bar, while the labels are spaced out, so a phase can change on a bar without a label. PS, PSY, Test and the distribution AR move the phase but are never labelled.
- The zigzag is a visual aid. The event rules use fixed 20, 30 and 50-bar windows, not the zigzag. The zigzag only draws the confirmed swings, so each Spring or upthrust can be judged against the structure by eye.
- The daily view adds context. On intraday charts the optional wave view shows the most recent daily swings of the current month: the last 10 points by default, which is the last 5 days.
🔵 WHAT IS ORIGINAL
- Spring and UTAD follow-through: the Spring is the test Wyckoff traders watch most closely. For a set number of bars after each Spring, a close back below the Spring low marks it FAILED. A small ✗ is drawn on the bar where the failure is confirmed, the Spring label itself stays as it was, the dashboard shows "Spring ✗" and an alert fires. UTADs mirror this with a close back above the UTAD high.
- Effort vs result on every event: each event label's tooltip shows the bar's volume and range against their averages and where the bar closed within its range. This is the comparison Wyckoff's law of effort vs result asks for.
- One closed-bar event engine: events are decided once per closed bar and spaced by the label distance. The same spaced events drive the labels, the dashboard's Last Event row and the event alerts, so every event alert matches a label on the chart.
🔵 HOW IT WORKS
Volume and range context feeds the event rules, the events drive the phase sequence, and spacing and follow-through come last. Events and phases are decided on closed bars only. The dashboard also reads the live bar.
1 — Volume and Range ContextPine Script®
2 — Accumulation EventsPine Script®
3 — Distribution EventsPine Script®
4 — Phase SequencePine Script®
5 — Labels, Spacing and Follow-Through
- Labelled events: SC, AR, Spring, SOS, LPS, BC, UTAD and LPSY. PS, PSY, ST, Test and the distribution AR are not labelled; all but ST move the phase, and ST only sets the reference level for LPS / LPSY. A label needs more than 20 bars since the previous label of any kind, and more than 20 bars (30 for AR, LPS and LPSY) since the same event [Min Bars Between Labels].
- Follow-through: for 20 bars after a Spring, a close below the Spring low marks it FAILED with a small ✗ on that bar; the Spring label itself is left unchanged. A UTAD fails on a close above its high. 0 turns the check off [Spring / UTAD Follow-Through Bars].
- Effort vs result: every label's tooltip lists volume against average volume, bar range against average range, and the close location within the bar (0 = low, 100 = high).
6 — Range Lines, Zigzag and Wave View
- Range lines: resistance at the range high, support at the range low and a dashed midpoint, redrawn whenever the range changes.
- Zigzag: a swing is confirmed when the bar 4 bars back is the highest high or lowest low of the last 9 bars, updated on closed bars only. It is drawn for reference and does not feed the event rules [Zigzag High/Low Length].
- Wave view (off by default): the most recent daily swings of the current month, taken from the last 10 daily bars and drawn as a mini zigzag with dated swing points in a panel below price. Number of Swing Legs sets how many points are kept: 10 by default, which is the last 5 days. The daily data is requested only while the wave view is on.
7 — Dashboard
- Phase: the current phase and how many bars ago it began.
- Pattern: Accumulation, Distribution, Spring, SOS, LPS, UTAD or LPSY.
- Last Event: the last labelled event and its age. A failed Spring or UTAD shows ✗.
- Event legend (optional): the key-events legend.
- Layout: text size and corner are adjustable [Dashboard Size, Dashboard Position].
🔵 KEY FEATURES
- Wyckoff events: SC, AR, Spring, SOS, LPS, BC, UTAD and LPSY, decided on closed bars and more than 20 bars apart by default
- Phase tracking: Phases A to E for accumulation and A to D for distribution, shown as a box over the trading range, with an optional timeline of recent phases
- Spring / UTAD follow-through: failed Springs and UTADs are marked ✗ and alerted
- Effort vs result: volume, range and close location in every event tooltip
- Trading range and swings: range high, low and midpoint lines plus a zigzag of confirmed swings
- Daily wave view (optional): the current month's daily swings in a mini panel
- Dashboard: phase with its age, pattern and last event
- Alerts: eleven alert conditions plus one alert() call for every event and every failure
🔵 HOW TO USE
Setup
- Chart: symbols with real volume (stocks, futures, crypto) on standard candlesticks. Trading ranges are easiest to read from 1H to 1D.
- Defaults: lookback 100, volume spike 1.5x, more than 20 bars between labels, follow-through 20 bars, zigzag length 4, wave view off.
Reading the Chart
- Phase box and name: the phase the rules currently assign, spanning the trading range from the bar where the phase began.
- Labels below price (SC, Spring, LPS) and above price (AR, SOS, BC, UTAD, LPSY): the candidate events. Hover a label for effort vs result.
- Small grey ✗: a Spring (✗ below the bar) or UTAD (✗ above the bar) failed: price closed back beyond its extreme within the follow-through window.
- Green, red and dashed lines: range support, resistance and midpoint.
- Teal / orange zigzag: confirmed swings.
Recommended Starting Points
- Intraday (15m-1H): defaults; on 15m try 30 bars between labels
- Swing (4H-1D): lookback 100-150
- Volatile crypto: volume spike multiplier 1.8-2.0
These are starting points only. Test on historical data and adjust before trading live.
🔵 SETTINGS
- Wyckoff Detection: lookback period, volume spike multiplier, Spring / UTAD follow-through bars (0 to 100; 0 turns the check off).
- Display: show event labels, show phase boxes, show support/resistance lines, show zigzag line, min bars between labels, label size, phase box transparency, label offset %, phase boxes kept.
- Detection Mode: auto-detect Wyckoff patterns (turns the event and phase engine on or off), one phase change per bar.
- Zigzag Settings: zigzag high/low length.
- Wave View: show wave view, wave view height, number of swing legs, show swing points.
- Dashboard: show dashboard, show event legend, dashboard position, dashboard size.
- Alerts: event alerts fire on (labelled events or every raw condition), one alert for every event.
🔵 ALERTS
- Selling Climax / Automatic Rally / Spring / Sign of Strength / Last Point of Support: the accumulation events
- Buying Climax / UTAD / Last Point of Supply: the distribution events
- Markup Phase: the phase changes to Phase E
- Spring Failed / UTAD Failed: a close back beyond the Spring low or UTAD high within the follow-through window
- Any alert() function call: every labelled event and every failure, with the phase, ticker, timeframe and close
By default the event alerts fire on the labelled events, which are spaced and decided on closed bars. "Every raw condition" restores the classic behaviour, where an alert can fire on consecutive bars. All alert conditions include {{ticker}}, {{interval}} and {{close}} placeholders.
🔵 LIMITATIONS & DISCLAIMER
- An approximation of a discretionary method: fixed rules will mark events that a Wyckoff analyst would reject and miss others that an analyst would accept. Check every label against the structure on the chart.
- Phases can jump: a new climax restarts Phase A at any time, and the distribution sequence stops at Phase D. The phase shown is the rules' current reading, not a forecast.
- Fixed thresholds: the 1% (AR, Spring, UTAD), 0.5% (ST) and 2% (Test) thresholds are fixed. They suit some assets and timeframes better than others.
- Volume quality varies: spot forex and many CFD feeds report tick volume, and some indices report none. Without real volume the events lose their meaning.
- Timing: events appear at the close of their bar and stay on the chart. A ✗ mark can appear later, on the bar where a Spring or UTAD fails. A zigzag swing is confirmed only after 4 more bars.
- Wave view: it uses daily data from the last 10 daily bars and sits below price, which widens the price scale.
- No guarantees: past behaviour of any event does not guarantee future results. Always use proper risk management and do your own analysis before trading.
🔵 HOUSE RULES & PURPOSE
- Educational purpose only: this indicator is published for educational and analytical purposes. It is not financial advice, not a trading recommendation and not a solicitation to buy or sell any asset. Nothing on the chart, in the dashboard or in the alerts should be taken as a promise of results.
- TradingView House Rules: this script is published open-source and in line with the TradingView House Rules. The description explains how every event, phase and read-out is calculated, makes no performance or win-rate claims, uses standard candlestick charts only, and the chart shown is clean with the symbol and timeframe visible.
- Your responsibility: test the indicator on historical data, understand each setting before changing it, and never risk more than you can afford to lose.
Published open-source by Viprasol.

Trading-systems engineers. We build custom MT4/MT5 expert advisors, prop-firm-compliant EAs, TradingView indicators, Pine-to-MQL5 ports and webhook-to-broker bridges. Backtested, forward-tested, source code yours. viprasol.com · WhatsApp +91 96336 52112
Haftungsausschluss
Die Informationen und Veröffentlichungen sind nicht als Finanz-, Anlage-, Handels- oder andere Arten von Ratschlägen oder Empfehlungen gedacht, die von TradingView bereitgestellt oder gebilligt werden, und stellen diese nicht dar. Lesen Sie mehr in den Nutzungsbedingungen.
Trading-systems engineers. We build custom MT4/MT5 expert advisors, prop-firm-compliant EAs, TradingView indicators, Pine-to-MQL5 ports and webhook-to-broker bridges. Backtested, forward-tested, source code yours. viprasol.com · WhatsApp +91 96336 52112
Haftungsausschluss
Die Informationen und Veröffentlichungen sind nicht als Finanz-, Anlage-, Handels- oder andere Arten von Ratschlägen oder Empfehlungen gedacht, die von TradingView bereitgestellt oder gebilligt werden, und stellen diese nicht dar. Lesen Sie mehr in den Nutzungsbedingungen.