OPEN-SOURCE SCRIPT
Aktualisiert All-Time High/Low Fibonacci Retracement (with Flip)
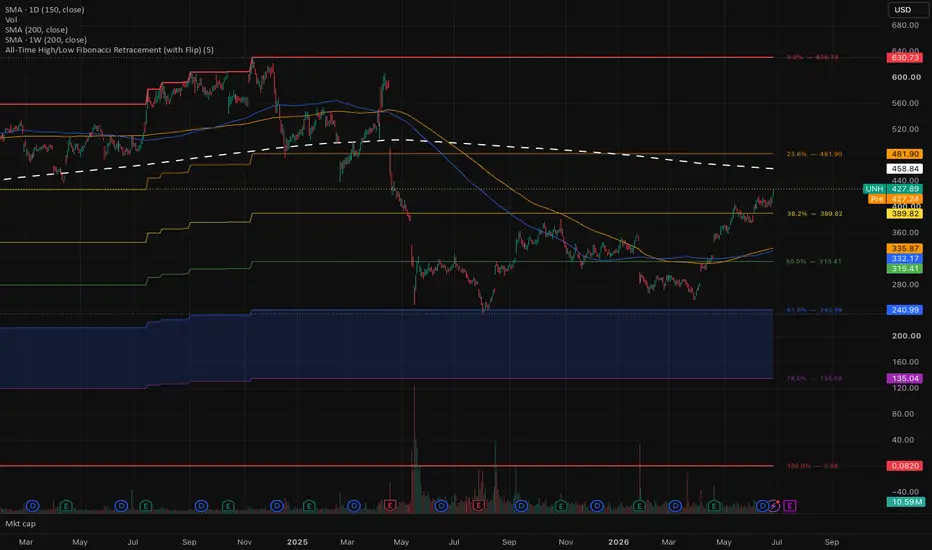
Tired of manually dragging the Fibonacci tool across macro charts every time an asset makes a new high or low? This indicator automates the entire process. It scans the absolute historical data of any asset to identify its true All-Time High (ATH) and All-Time Low (ATL), then dynamically projects standard Fibonacci retracement levels between them.
Whether you are analyzing a stock's decades-long macro cycle or looking for major historical support and resistance levels, this script keeps your charts perfectly anchored without the manual clutter.
Key Features
100% Automated Tracking: Uses historical state variables (var) to lock onto the ultimate lowest and highest prices ever printed on your current chart.
Real-Time Dynamic Updates: If the asset breaks out into price discovery (new ATH) or capitulates to a new bottom (new ATL), the script recalculates and shifts all Fibonacci lines instantly.
One-Click Flip Toggle: Built-in calculation flip. Measure retracements from the top down (bearish retracement) or flip it from the bottom up (bullish expansion) right from the settings menu.
Clean Visuals: Hard-coded with classic Fibonacci ratios (23.6%, 38.2%, 50.0%, 61.8%, 78.6%) using a subtle, non-intrusive color gradient that won't crowd your daily price action.
How to Use the Settings
Flip Retracement (Checkbox): * Unchecked (Default): Places 0% at the All-Time High and 100% at the All-Time Low (Ideal for finding support levels during a pullback from macro highs).
Checked: Places 0% at the All-Time Low and 100% at the All-Time High (Ideal for tracking major resistance levels and targets on the way back up).
💡 Pro-Tip: Because TradingView loads a limited number of historical bars on lower timeframes (like 5-minute or 15-minute charts), always load this indicator on a Daily (D), Weekly (W), or Monthly (M) chart first. This ensures the script catches the true historical inception highs and lows of the asset!
Whether you are analyzing a stock's decades-long macro cycle or looking for major historical support and resistance levels, this script keeps your charts perfectly anchored without the manual clutter.
Key Features
100% Automated Tracking: Uses historical state variables (var) to lock onto the ultimate lowest and highest prices ever printed on your current chart.
Real-Time Dynamic Updates: If the asset breaks out into price discovery (new ATH) or capitulates to a new bottom (new ATL), the script recalculates and shifts all Fibonacci lines instantly.
One-Click Flip Toggle: Built-in calculation flip. Measure retracements from the top down (bearish retracement) or flip it from the bottom up (bullish expansion) right from the settings menu.
Clean Visuals: Hard-coded with classic Fibonacci ratios (23.6%, 38.2%, 50.0%, 61.8%, 78.6%) using a subtle, non-intrusive color gradient that won't crowd your daily price action.
How to Use the Settings
Flip Retracement (Checkbox): * Unchecked (Default): Places 0% at the All-Time High and 100% at the All-Time Low (Ideal for finding support levels during a pullback from macro highs).
Checked: Places 0% at the All-Time Low and 100% at the All-Time High (Ideal for tracking major resistance levels and targets on the way back up).
💡 Pro-Tip: Because TradingView loads a limited number of historical bars on lower timeframes (like 5-minute or 15-minute charts), always load this indicator on a Daily (D), Weekly (W), or Monthly (M) chart first. This ensures the script catches the true historical inception highs and lows of the asset!
Versionshinweise
Adding precent labelsVersionshinweise
Plots Fibonacci retracement levels anchored to the all-time high and all-time low of the loaded chart history. The range updates automatically as new highs or lows print, so the levels always reflect the full extent of price action without manual redrawing.Features:
- Auto ATH/ATL tracking — the 0% and 100% anchors update dynamically across all available history.
- Flip toggle — switch 0% between the top (all-time high) and the bottom (all-time low) to suit your bias or the direction of the move you're measuring.
- Standard Fib levels — 0%, 23.6%, 38.2%, 50%, 61.8%, 78.6%, and 100%, each color-coded.
- On-chart labels — every level shows its retracement percentage alongside the exact price, placed to the right of the last bar. Adjustable offset.
- Golden pocket shading — the 61.8%–78.6% reaction zone is highlighted for quick visual reference. Toggle on/off.
- Built-in alerts — alert conditions on crosses of each major level, plus a golden-pocket entry alert, ready to wire up from the Create Alert dialog.
Notes: Levels are based on the chart's loaded history, so the all-time high/low depends on how far back your data goes and your timeframe. This is an analysis tool, not financial advice — use it alongside your own process and risk management.
Versionshinweise
ChartVersionshinweise
WHAT'S NEWAdded: Moving Averages
- Two configurable moving averages (default 150 & 200).
- Independent timeframe control per MA — choose Daily, Weekly, or Monthly for each one separately (e.g. a weekly 150 alongside a monthly 200).
- Full color picker for each MA line.
- Adjustable length for each MA.
- Master show/hide toggle for both MAs at once.
- MAs are pulled from their selected timeframe via higher-timeframe data, so they stay true to that timeframe even when viewed on a lower chart timeframe.
Note: Higher-timeframe MAs require proportionally more history to populate — a monthly 200 SMA needs roughly 17 years of data before it fully renders.
Open-source Skript
Ganz im Sinne von TradingView hat dieser Autor sein/ihr Script als Open-Source veröffentlicht. Auf diese Weise können nun auch andere Trader das Script rezensieren und die Funktionalität überprüfen. Vielen Dank an den Autor! Sie können das Script kostenlos verwenden, aber eine Wiederveröffentlichung des Codes unterliegt unseren Hausregeln.

Haftungsausschluss
Die Informationen und Veröffentlichungen sind nicht als Finanz-, Anlage-, Handels- oder andere Arten von Ratschlägen oder Empfehlungen gedacht, die von TradingView bereitgestellt oder gebilligt werden, und stellen diese nicht dar. Lesen Sie mehr in den Nutzungsbedingungen.
Open-source Skript
Ganz im Sinne von TradingView hat dieser Autor sein/ihr Script als Open-Source veröffentlicht. Auf diese Weise können nun auch andere Trader das Script rezensieren und die Funktionalität überprüfen. Vielen Dank an den Autor! Sie können das Script kostenlos verwenden, aber eine Wiederveröffentlichung des Codes unterliegt unseren Hausregeln.
Haftungsausschluss
Die Informationen und Veröffentlichungen sind nicht als Finanz-, Anlage-, Handels- oder andere Arten von Ratschlägen oder Empfehlungen gedacht, die von TradingView bereitgestellt oder gebilligt werden, und stellen diese nicht dar. Lesen Sie mehr in den Nutzungsbedingungen.