OPEN-SOURCE SCRIPT
News Impact Analyzer [forexobroker]
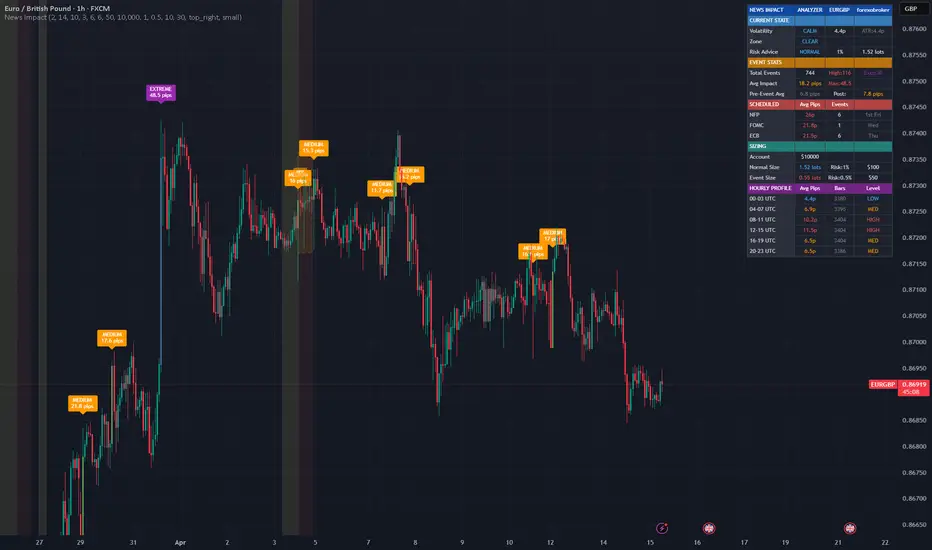
News Impact Analyzer bridges the gap between fundamental events and technical price action. Instead of relying on external calendars, it detects volatility spikes directly from price data, tracks recurring scheduled events (NFP, FOMC, ECB), measures their historical pip impact, and adjusts your risk management recommendations automatically.
THE PROBLEM WITH NEWS TRADING
Most traders know that news moves markets, but they handle it poorly:
No Historical Context — NFP just dropped and EURUSD moved 80 pips. Is that normal? Without historical impact data, you can't assess whether the move is an overreaction or just getting started. This indicator tracks average pip movement per event type so you have context.
No Pre-Event Awareness — You enter a trade 30 minutes before NFP and get stopped out by the spike. Without a pre-event warning system, you're walking into a minefield blindfolded. This indicator highlights pre-event windows and recommends avoiding new positions.
Wrong Position Sizing — You trade the same lot size during NFP as during Asian session lulls. During high-volatility events, the same position size carries 3-5× more risk. This indicator calculates separate position sizes for normal conditions and event windows.
No Volatility Profile — You don't know that your pair moves twice as much during London session compared to Asia. Without an hourly volatility profile, you're missing the rhythm of the market. This indicator builds a profile from actual price data.
HOW IT WORKS
1. Volatility Spike Detection
The indicator identifies bars where the range (high - low) exceeds a configurable ATR multiplier. These spikes represent high-impact events — whether from scheduled news, unexpected announcements, or institutional activity.
Classification:
Low: 2-3× ATR (routine volatility expansion)
Medium: 3-4× ATR (significant market move)
High: 4× ATR (major event impact)
Extreme: 4×+ ATR (crisis-level volatility)
Nearby spikes are merged to prevent double-counting clustered events.
2. Scheduled Event Detection
The indicator automatically detects recurring forex events:
Event Detection Typical Impact
NFP First Friday of each month, 13:00 UTC bar 50-150 pips on USD pairs
FOMC Mid-month Wednesday in FOMC months, 19:00 UTC 30-100 pips on USD pairs
ECB Mid-month Thursday in ECB months, 13:00 UTC 20-80 pips on EUR pairs
Each event type tracks its own historical average pip impact.
3. Pre/Post Event Windows
Pre-Event Zone (yellow background): Bars before a scheduled event. The indicator warns against new positions during this window — spreads widen, liquidity thins, and any position faces imminent high-volatility risk.
Post-Event Zone (red-tinted background): Bars after a detected event. Volatility often remains elevated as the market digests the move.
4. Hourly Volatility Profile
The dashboard builds a volatility profile from actual price data, showing average pip movement per 4-hour UTC block. This reveals your pair's natural rhythm — when it's most active and when it's quiet.
5. Position Sizing Recommendations
Two sizing recommendations are always available:
Normal Size: Based on standard ATR and your normal risk percentage
Event Size: Reduced risk percentage with wider expected stops, calculated from historical event volatility
During pre-event and post-event windows, the dashboard automatically recommends the reduced event size.
ANALYTICS DASHBOARD
Section Shows
Current State Volatility level (Calm/Normal/Elevated/Extreme), current bar range, ATR
Zone Pre-event, post-event, or clear status
Risk Advice Normal trading, reduced size, or avoid new positions
Event Stats Total events, high/extreme counts, average and max impact
Pre/Post Avg Average volatility during pre-event vs post-event windows
Scheduled NFP, FOMC, ECB average pips and event counts
Sizing Normal vs event lot sizes with risk amounts
Hourly Profile 4-hour block volatility averages with HIGH/MED/LOW ratings
FEATURES
Volatility spike detection with ATR-based threshold
4-level impact classification (Low/Medium/High/Extreme)
Spike merging to prevent double-counting
Scheduled event detection (NFP, FOMC, ECB)
Per-event historical pip tracking
Pre-event warning zones with background highlighting
Post-event volatility window tracking
Hourly volatility profile (4-hour UTC blocks)
Position sizing for normal and event conditions
Risk advisory system (Normal/Reduced/Avoid)
Expected impact range boxes on scheduled events
Bar coloring by spike impact level
Comprehensive analytics dashboard
Theme-aware colors for light and dark charts
Data Window integration for all metrics
7 alert conditions including pre-event warnings
Zero request.security() calls
barstate.isconfirmed on all spike detections — no repainting
Works on any forex pair and timeframe
ALERTS
Alert Fires When
High Impact Event Volatility spike ≥ 3× ATR detected
Extreme Impact Event Volatility spike ≥ 4× ATR detected
Any Volatility Spike Any spike above threshold
Scheduled Event NFP, FOMC, or ECB bar detected
Pre-Event Warning Entering pre-event window
Post-Event Start Post-event volatility window begins
Any Event Any spike or scheduled event
USE CASES
Pre-News Risk Management — Set alerts on "Pre-Event Warning" to get notified before NFP, FOMC, or ECB releases. Close or tighten positions before the spike hits.
Event Impact Assessment — After a news release, check the dashboard to see how the current move compares to historical averages. If the move is significantly larger than the average NFP impact, it may be overextended.
Session Planning — Use the hourly volatility profile to identify the best trading hours for your pair. Trade during HIGH volatility blocks for breakout strategies, or during LOW blocks for range trading.
Position Sizing Discipline — Let the indicator calculate appropriate lot sizes for both normal conditions and event windows. Never be over-leveraged during a news release again.
Volatility Regime Detection — The current state indicator (Calm/Normal/Elevated/Extreme) helps you choose the right strategy. Trend-following in elevated conditions, mean-reversion in calm conditions.
SETTINGS OVERVIEW
Event Detection: Spike threshold (ATR multiplier), ATR length, minimum spike size in pips, merge window.
Scheduled Events: NFP/FOMC/ECB toggles, pre-event and post-event bar windows.
Impact Analysis: Event lookback count, expected impact range display.
Position Sizing: Account size, normal risk %, event risk %, no-trade zone toggle, pip value.
Display: Dashboard, event labels, volatility profile, zone backgrounds, max labels, table position, text size.
Colors: Low/medium/high/extreme impact, pre-event zone, neutral.
TECHNICAL NOTES
Zero request.security() calls — all analysis on chart timeframe
Spike detection on barstate.isconfirmed only — no repainting
Scheduled events use UTC hour detection for consistent timing
NFP detection: dayofweek.friday AND dayofmonth <= 7 AND hour == 13 UTC
FOMC detection: FOMC-month Wednesdays, mid-month, hour == 19 UTC
ECB detection: ECB-month Thursdays, mid-month, hour == 13 UTC
Hourly profile builds from actual bar data — accuracy improves with more history
Position sizing uses standard forex lot calculation
Pre/post event stats tracked in separate arrays for accurate comparison
DISCLAIMER
This indicator is for educational and informational purposes only. It does not constitute financial advice. Scheduled event detection uses approximate date patterns and may not match exact economic calendar dates every time. Volatility spike detection is reactive by nature — it identifies events after they begin, not before. Always verify scheduled event times against an official economic calendar. Past volatility patterns do not guarantee future movements. Use proper risk management at all times.
THE PROBLEM WITH NEWS TRADING
Most traders know that news moves markets, but they handle it poorly:
No Historical Context — NFP just dropped and EURUSD moved 80 pips. Is that normal? Without historical impact data, you can't assess whether the move is an overreaction or just getting started. This indicator tracks average pip movement per event type so you have context.
No Pre-Event Awareness — You enter a trade 30 minutes before NFP and get stopped out by the spike. Without a pre-event warning system, you're walking into a minefield blindfolded. This indicator highlights pre-event windows and recommends avoiding new positions.
Wrong Position Sizing — You trade the same lot size during NFP as during Asian session lulls. During high-volatility events, the same position size carries 3-5× more risk. This indicator calculates separate position sizes for normal conditions and event windows.
No Volatility Profile — You don't know that your pair moves twice as much during London session compared to Asia. Without an hourly volatility profile, you're missing the rhythm of the market. This indicator builds a profile from actual price data.
HOW IT WORKS
1. Volatility Spike Detection
The indicator identifies bars where the range (high - low) exceeds a configurable ATR multiplier. These spikes represent high-impact events — whether from scheduled news, unexpected announcements, or institutional activity.
Classification:
Low: 2-3× ATR (routine volatility expansion)
Medium: 3-4× ATR (significant market move)
High: 4× ATR (major event impact)
Extreme: 4×+ ATR (crisis-level volatility)
Nearby spikes are merged to prevent double-counting clustered events.
2. Scheduled Event Detection
The indicator automatically detects recurring forex events:
Event Detection Typical Impact
NFP First Friday of each month, 13:00 UTC bar 50-150 pips on USD pairs
FOMC Mid-month Wednesday in FOMC months, 19:00 UTC 30-100 pips on USD pairs
ECB Mid-month Thursday in ECB months, 13:00 UTC 20-80 pips on EUR pairs
Each event type tracks its own historical average pip impact.
3. Pre/Post Event Windows
Pre-Event Zone (yellow background): Bars before a scheduled event. The indicator warns against new positions during this window — spreads widen, liquidity thins, and any position faces imminent high-volatility risk.
Post-Event Zone (red-tinted background): Bars after a detected event. Volatility often remains elevated as the market digests the move.
4. Hourly Volatility Profile
The dashboard builds a volatility profile from actual price data, showing average pip movement per 4-hour UTC block. This reveals your pair's natural rhythm — when it's most active and when it's quiet.
5. Position Sizing Recommendations
Two sizing recommendations are always available:
Normal Size: Based on standard ATR and your normal risk percentage
Event Size: Reduced risk percentage with wider expected stops, calculated from historical event volatility
During pre-event and post-event windows, the dashboard automatically recommends the reduced event size.
ANALYTICS DASHBOARD
Section Shows
Current State Volatility level (Calm/Normal/Elevated/Extreme), current bar range, ATR
Zone Pre-event, post-event, or clear status
Risk Advice Normal trading, reduced size, or avoid new positions
Event Stats Total events, high/extreme counts, average and max impact
Pre/Post Avg Average volatility during pre-event vs post-event windows
Scheduled NFP, FOMC, ECB average pips and event counts
Sizing Normal vs event lot sizes with risk amounts
Hourly Profile 4-hour block volatility averages with HIGH/MED/LOW ratings
FEATURES
Volatility spike detection with ATR-based threshold
4-level impact classification (Low/Medium/High/Extreme)
Spike merging to prevent double-counting
Scheduled event detection (NFP, FOMC, ECB)
Per-event historical pip tracking
Pre-event warning zones with background highlighting
Post-event volatility window tracking
Hourly volatility profile (4-hour UTC blocks)
Position sizing for normal and event conditions
Risk advisory system (Normal/Reduced/Avoid)
Expected impact range boxes on scheduled events
Bar coloring by spike impact level
Comprehensive analytics dashboard
Theme-aware colors for light and dark charts
Data Window integration for all metrics
7 alert conditions including pre-event warnings
Zero request.security() calls
barstate.isconfirmed on all spike detections — no repainting
Works on any forex pair and timeframe
ALERTS
Alert Fires When
High Impact Event Volatility spike ≥ 3× ATR detected
Extreme Impact Event Volatility spike ≥ 4× ATR detected
Any Volatility Spike Any spike above threshold
Scheduled Event NFP, FOMC, or ECB bar detected
Pre-Event Warning Entering pre-event window
Post-Event Start Post-event volatility window begins
Any Event Any spike or scheduled event
USE CASES
Pre-News Risk Management — Set alerts on "Pre-Event Warning" to get notified before NFP, FOMC, or ECB releases. Close or tighten positions before the spike hits.
Event Impact Assessment — After a news release, check the dashboard to see how the current move compares to historical averages. If the move is significantly larger than the average NFP impact, it may be overextended.
Session Planning — Use the hourly volatility profile to identify the best trading hours for your pair. Trade during HIGH volatility blocks for breakout strategies, or during LOW blocks for range trading.
Position Sizing Discipline — Let the indicator calculate appropriate lot sizes for both normal conditions and event windows. Never be over-leveraged during a news release again.
Volatility Regime Detection — The current state indicator (Calm/Normal/Elevated/Extreme) helps you choose the right strategy. Trend-following in elevated conditions, mean-reversion in calm conditions.
SETTINGS OVERVIEW
Event Detection: Spike threshold (ATR multiplier), ATR length, minimum spike size in pips, merge window.
Scheduled Events: NFP/FOMC/ECB toggles, pre-event and post-event bar windows.
Impact Analysis: Event lookback count, expected impact range display.
Position Sizing: Account size, normal risk %, event risk %, no-trade zone toggle, pip value.
Display: Dashboard, event labels, volatility profile, zone backgrounds, max labels, table position, text size.
Colors: Low/medium/high/extreme impact, pre-event zone, neutral.
TECHNICAL NOTES
Zero request.security() calls — all analysis on chart timeframe
Spike detection on barstate.isconfirmed only — no repainting
Scheduled events use UTC hour detection for consistent timing
NFP detection: dayofweek.friday AND dayofmonth <= 7 AND hour == 13 UTC
FOMC detection: FOMC-month Wednesdays, mid-month, hour == 19 UTC
ECB detection: ECB-month Thursdays, mid-month, hour == 13 UTC
Hourly profile builds from actual bar data — accuracy improves with more history
Position sizing uses standard forex lot calculation
Pre/post event stats tracked in separate arrays for accurate comparison
DISCLAIMER
This indicator is for educational and informational purposes only. It does not constitute financial advice. Scheduled event detection uses approximate date patterns and may not match exact economic calendar dates every time. Volatility spike detection is reactive by nature — it identifies events after they begin, not before. Always verify scheduled event times against an official economic calendar. Past volatility patterns do not guarantee future movements. Use proper risk management at all times.
Open-source Skript
Ganz im Sinne von TradingView hat dieser Autor sein/ihr Script als Open-Source veröffentlicht. Auf diese Weise können nun auch andere Trader das Script rezensieren und die Funktionalität überprüfen. Vielen Dank an den Autor! Sie können das Script kostenlos verwenden, aber eine Wiederveröffentlichung des Codes unterliegt unseren Hausregeln.

🔵Gain access to our powerful tools : forexobroker.com/tv
🔵Join our free telegram for updates : t.me/dominicwalsfxhtrader
All scripts & content provided by Forexobroker are for informational & educational purposes only.
🔵Join our free telegram for updates : t.me/dominicwalsfxhtrader
All scripts & content provided by Forexobroker are for informational & educational purposes only.
Haftungsausschluss
Die Informationen und Veröffentlichungen sind nicht als Finanz-, Anlage-, Handels- oder andere Arten von Ratschlägen oder Empfehlungen gedacht, die von TradingView bereitgestellt oder gebilligt werden, und stellen diese nicht dar. Lesen Sie mehr in den Nutzungsbedingungen.
Open-source Skript
Ganz im Sinne von TradingView hat dieser Autor sein/ihr Script als Open-Source veröffentlicht. Auf diese Weise können nun auch andere Trader das Script rezensieren und die Funktionalität überprüfen. Vielen Dank an den Autor! Sie können das Script kostenlos verwenden, aber eine Wiederveröffentlichung des Codes unterliegt unseren Hausregeln.
🔵Gain access to our powerful tools : forexobroker.com/tv
🔵Join our free telegram for updates : t.me/dominicwalsfxhtrader
All scripts & content provided by Forexobroker are for informational & educational purposes only.
🔵Join our free telegram for updates : t.me/dominicwalsfxhtrader
All scripts & content provided by Forexobroker are for informational & educational purposes only.
Haftungsausschluss
Die Informationen und Veröffentlichungen sind nicht als Finanz-, Anlage-, Handels- oder andere Arten von Ratschlägen oder Empfehlungen gedacht, die von TradingView bereitgestellt oder gebilligt werden, und stellen diese nicht dar. Lesen Sie mehr in den Nutzungsbedingungen.