DrFX God Mode X - Fusion17 Adaptive Consensus
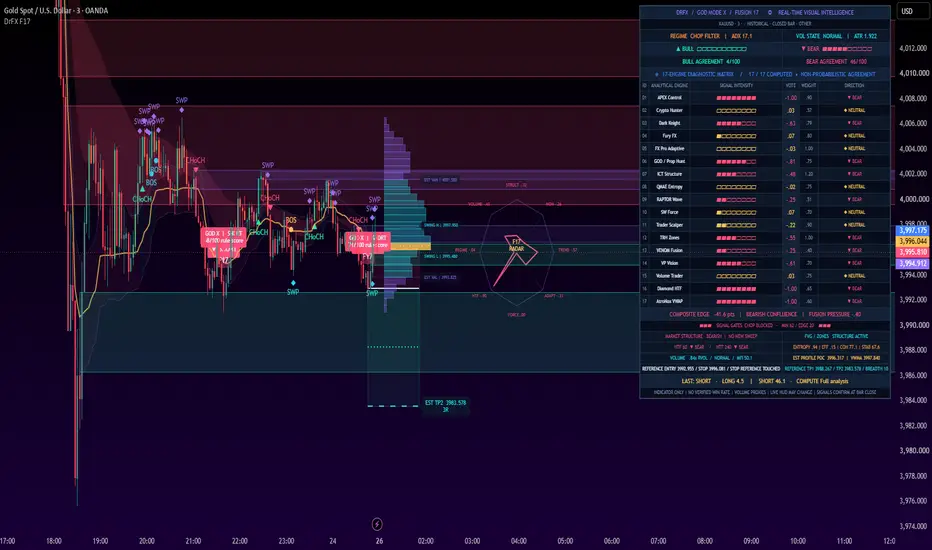
🚀 DrFX God Mode X — Fusion17 Adaptive Consensus
Welcome to DrFX God Mode X, a multi-engine technical analysis system designed to bring trend analysis, momentum, liquidity, market structure, and volatility into one unified trading environment.
Powered by 17 analytical engines, God Mode X transforms multiple market observations into an adaptive directional consensus.
Its objective is simple: provide traders with a clearer, more structured view of market conditions without requiring multiple separate indicators.
━━━━━━━━━━━━━━━━━━━━
🧠 1. Fusion17 — The Analytical Core
At the heart of God Mode X is a weighted consensus framework built around 17 specialized analytical modules.
Each engine independently evaluates selected market conditions and generates a directional vote between -1 and +1.
🟢 Positive values indicate bullish conditions.
🔴 Negative values indicate bearish conditions.
⚪ Values near zero indicate limited directional conviction.
The system combines these measurements into bullish and bearish rule-agreement scores ranging from 0 to 100.
Engine weights can adjust automatically according to market regime, volatility, and selected statistical conditions.
These scores measure agreement between technical rules. They do not represent probabilities of profitable trades or verified win rates.
━━━━━━━━━━━━━━━━━━━━
⚙️ 2. Meet the 17 Analytical Engines
The Fusion17 framework brings together multiple areas of technical analysis.
📈 Trend and Momentum
01 — APEX Control
Analyzes EMA relationships, market direction, and macro trend alignment.
02 — Crypto Hunter
Identifies price-channel breakouts and normalized momentum.
03 — Dark Knight
Combines SuperTrend and ADX to evaluate directional strength.
04 — Fury FX
Examines candle pressure and estimated directional volume behavior.
05 — FX Pro Adaptive
Uses adaptive moving-average calculations to evaluate price momentum.
🎯 Price Action and Market Structure
06 — GOD / Prop Hunter
Studies previous-day ranges and directional price expansion.
07 — ICT Structure
Analyzes BOS, CHoCH, liquidity sweeps, and Fair Value Gaps.
08 — QMAE Entropy
Measures recent directional uncertainty using simplified Shannon entropy.
09 — RAPTOR Wave
Combines multi-scale price differences, momentum, and regression slopes.
10 — SW Force
Evaluates candle pressure and relative-volume intensity.
📊 Advanced Technical Confluence
11 — Trader Scalper
Combines volatility-normalized price deviation and engulfing patterns.
12 — Trading Room Hunter
Evaluates supply and demand reference zones and displacement conditions.
13 — VENOM Fusion
Combines EMA, SuperTrend, and MACD directional confirmation.
14 — Volume Profile Vision
Uses volume-weighted price measurements for historical directional scoring.
15 — Volume Trader
Integrates Money Flow Index and relative-volume analysis.
🌐 Higher-Timeframe Intelligence
16 — Diamond HTF
Measures directional agreement using confirmed higher-timeframe data.
17 — AtroNox VWAP
Combines VWAP, RSI, and moving-average trend information.
These engines use separately formulated analytical rules. They are not claimed to be exact mathematical reproductions of other published indicators.
━━━━━━━━━━━━━━━━━━━━
📊 3. Adaptive Market Consensus
God Mode X continuously evaluates the balance between bullish and bearish technical evidence.
The consensus framework considers:
• Directional strength and momentum
• Trend alignment and market regime
• Market structure and liquidity conditions
• Volatility and estimated volume behavior
• Higher-timeframe directional agreement
• Engine contribution and relative weighting
The dashboard displays the resulting analytical measurements so traders can identify whether conditions favor bullish, bearish, or mixed interpretations.
Because multiple engines use related price inputs, their votes should not be treated as statistically independent evidence.
━━━━━━━━━━━━━━━━━━━━
🎯 4. Confirmed Buy and Sell Signals
God Mode X generates LONG and SHORT observations when its configured analytical requirements are satisfied.
🟢 LONG Setup
A bullish signal may occur when a qualifying price-action trigger aligns with sufficient bullish consensus, trend conditions, and applicable filters.
🔴 SHORT Setup
A bearish signal may occur when a qualifying bearish trigger aligns with sufficient bearish consensus and the selected confirmation requirements.
Additional filters include:
• Minimum analytical score
• Directional score difference
• Market regime restrictions
• EMA trend alignment
• Engine breadth confirmation
• Signal cooldown periods
Signals are confirmed after the chart candle closes.
Signals represent technical observations, not guaranteed future market direction.
━━━━━━━━━━━━━━━━━━━━
💎 5. Smart Money Concepts and Liquidity
The indicator includes several price-action analysis tools.
🔹 BOS — Break of Structure
Identifies confirmed price breaks beyond established swing references.
🔹 CHoCH — Change of Character
Highlights qualifying structural breaks against the previously recorded market direction.
🔹 Liquidity Sweeps
Detects price movement beyond confirmed swing levels followed by a close back across those levels.
🔹 Fair Value Gaps
Highlights qualifying three-candle price gaps and monitors their subsequent interaction with price.
🔹 Supply and Demand Zones
Displays selected displacement-origin reference zones associated with market-structure events.
These calculations analyze observable price behavior. They do not reveal actual institutional order positions or hidden market liquidity.
━━━━━━━━━━━━━━━━━━━━
🌐 6. Multi-Timeframe Analysis
God Mode X supports two configurable higher-timeframe references.
The system evaluates previously completed higher-timeframe candles to provide additional trend context.
Traders can compare current market conditions with broader directional movements.
For proper operation, the selected higher timeframes should be greater than the active chart timeframe.
━━━━━━━━━━━━━━━━━━━━
📉 7. Estimated Volume Distribution
The indicator includes a right-edge volume-distribution visualization.
Using historical candle ranges and volume data, it estimates how traded volume may be distributed across selected price intervals.
The display includes:
• Estimated Point of Control (POC)
• Estimated Value Area High (VAH)
• Estimated Value Area Low (VAL)
• Relative volume-distribution levels
Important: This is an OHLCV-based approximation, not a true tick-level volume profile, exchange footprint, or order-book measurement.
━━━━━━━━━━━━━━━━━━━━
🖥️ 8. Advanced Intelligence Dashboard
God Mode X features a multi-section analytical dashboard designed to organize complex market information into a single visual interface.
The dashboard includes:
🟢 Bullish and bearish consensus scores
📈 Trend direction and market regime
📊 Individual engine contributions
🌐 Higher-timeframe context
⚡ Momentum and volatility measurements
💎 Market structure and liquidity observations
🎯 Illustrative trade reference levels
An additional engine matrix provides visibility into the directional measurements and relative weights of all 17 modules.
The eight-axis confluence radar groups selected market measurements into a compact visual summary.
These displays provide descriptive analytical information, not statistically calibrated prediction confidence.
━━━━━━━━━━━━━━━━━━━━
✨ 9. Advanced Chart Visualization
God Mode X includes customizable visual elements designed to make complex market information easier to interpret.
Available features include:
• Adaptive neon trend clouds
• Dynamic candle coloring
• Statistical price ribbons
• Spectral-style volatility envelopes
• Market-structure labels
• Supply and demand zones
• Liquidity reference levels
• Interactive-looking chart diagnostics
• Tick-driven dashboard visual updates
The visual style is inspired by modern analytical dashboards.
Terms such as spectral and quantum-style refer to mathematical descriptions and graphical presentation. They do not imply quantum computing or independently trained AI prediction.
Realtime visual elements update only when TradingView processes new market data.
━━━━━━━━━━━━━━━━━━━━
🛡️ 10. Risk and Reward Visualizer
After a confirmed signal, the indicator can display an illustrative trading setup.
The reference geometry includes:
🎯 Entry reference — Based on the confirmed signal candle.
🔴 Stop Loss — Calculated using a configurable ATR multiplier.
🟢 Take Profit 1 — First configurable reward multiple.
🔵 Take Profit 2 — Second configurable reward multiple.
Traders can adjust the ATR distance, target multiples, and visual projection width.
The system also monitors whether later candles touch selected reference levels.
When both stop and target are touched within the same candle, the outcome is marked as ambiguous because OHLC data cannot establish the exact sequence.
This feature is not a TradingView Strategy Tester backtest and does not represent actual trade execution.
━━━━━━━━━━━━━━━━━━━━
🔔 11. Smart Alert System
God Mode X includes configurable notifications for important analytical events.
Available alerts include:
• Confirmed bullish setups
• Confirmed bearish setups
• Either directional signal
• Market-structure breaks
• Liquidity sweep events
Selected alerts can include analytical scores and illustrative risk levels.
Alerts provide informational notifications and do not independently execute trades.
━━━━━━━━━━━━━━━━━━━━
🚀 12. How to Use God Mode X
Step 1 — Add the indicator to a standard candlestick chart.
Step 2 — Configure the two higher-timeframe references.
Step 3 — Observe the prevailing market regime and directional consensus.
Step 4 — Review the individual engine matrix to identify supporting and conflicting analytical evidence.
Step 5 — Evaluate confirmed LONG or SHORT setups in the context of market structure and volatility.
Step 6 — Review the illustrative stop-loss and target references.
Step 7 — Adjust the indicator settings to match the instrument and timeframe being analyzed.
For initial evaluation, begin with the default settings and observe signal behavior across different market conditions.
Independent historical testing and forward observation are recommended.
━━━━━━━━━━━━━━━━━━━━
🔬 13. Research and Originality
The main contribution of God Mode X is its unified implementation of 17 technical analysis categories within an adaptive weighted-consensus framework.
The indicator combines directional scoring, market-regime adjustments, analytical transparency, price-action structures, volatility measurements, and integrated chart diagnostics.
Its purpose is to reduce the need to manage numerous separate analytical tools while preserving visibility into their individual contributions.
Reference materials used during development included scripts carrying copyright notices attributed to raptoralgo.
The modules presented here use separately formulated calculations and are not described as mathematically equivalent copies of those references.
Any third-party code incorporated into a published version must comply with applicable licensing, attribution, and TradingView publication requirements.
━━━━━━━━━━━━━━━━━━━━
⚠️ 14. Important Technical Limitations
Please consider the following before using the indicator:
• Technical consensus scores are not trading success probabilities.
• Related analytical engines can produce correlated measurements.
• Volume flow calculations may use candle-derived approximations rather than actual trade delta.
• Estimated volume distribution is not exchange-level volume-at-price data.
• Swing structures require additional confirmation candles.
• Live dashboard values can change while the current candle is developing.
• Historical signal observations do not guarantee identical future market behavior.
• Illustrative trade outcomes do not account for commissions, spreads, slippage, or actual execution conditions.
• Market characteristics and available data can affect indicator calculations.
No analytical system can predict every market movement or eliminate financial risk.
━━━━━━━━━━━━━━━━━━━━
📚 15. Educational Purpose and Disclaimer
DrFX God Mode X is intended for technical analysis, educational purposes, and independent market research.
The indicator does not provide personalized investment advice, guaranteed signals, or promises of profitability.
All market participants should independently evaluate trading opportunities and apply appropriate risk-management practices.
Past hypothetical observations do not guarantee future performance.
━━━━━━━━━━━━━━━━━━━━
Developed by DrFXAi
Fusion17 Adaptive Consensus | Pine Script v6
Welcome to DrFX God Mode X, a multi-engine technical analysis system designed to bring trend analysis, momentum, liquidity, market structure, and volatility into one unified trading environment.
Powered by 17 analytical engines, God Mode X transforms multiple market observations into an adaptive directional consensus.
Its objective is simple: provide traders with a clearer, more structured view of market conditions without requiring multiple separate indicators.
━━━━━━━━━━━━━━━━━━━━
🧠 1. Fusion17 — The Analytical Core
At the heart of God Mode X is a weighted consensus framework built around 17 specialized analytical modules.
Each engine independently evaluates selected market conditions and generates a directional vote between -1 and +1.
🟢 Positive values indicate bullish conditions.
🔴 Negative values indicate bearish conditions.
⚪ Values near zero indicate limited directional conviction.
The system combines these measurements into bullish and bearish rule-agreement scores ranging from 0 to 100.
Engine weights can adjust automatically according to market regime, volatility, and selected statistical conditions.
These scores measure agreement between technical rules. They do not represent probabilities of profitable trades or verified win rates.
━━━━━━━━━━━━━━━━━━━━
⚙️ 2. Meet the 17 Analytical Engines
The Fusion17 framework brings together multiple areas of technical analysis.
📈 Trend and Momentum
01 — APEX Control
Analyzes EMA relationships, market direction, and macro trend alignment.
02 — Crypto Hunter
Identifies price-channel breakouts and normalized momentum.
03 — Dark Knight
Combines SuperTrend and ADX to evaluate directional strength.
04 — Fury FX
Examines candle pressure and estimated directional volume behavior.
05 — FX Pro Adaptive
Uses adaptive moving-average calculations to evaluate price momentum.
🎯 Price Action and Market Structure
06 — GOD / Prop Hunter
Studies previous-day ranges and directional price expansion.
07 — ICT Structure
Analyzes BOS, CHoCH, liquidity sweeps, and Fair Value Gaps.
08 — QMAE Entropy
Measures recent directional uncertainty using simplified Shannon entropy.
09 — RAPTOR Wave
Combines multi-scale price differences, momentum, and regression slopes.
10 — SW Force
Evaluates candle pressure and relative-volume intensity.
📊 Advanced Technical Confluence
11 — Trader Scalper
Combines volatility-normalized price deviation and engulfing patterns.
12 — Trading Room Hunter
Evaluates supply and demand reference zones and displacement conditions.
13 — VENOM Fusion
Combines EMA, SuperTrend, and MACD directional confirmation.
14 — Volume Profile Vision
Uses volume-weighted price measurements for historical directional scoring.
15 — Volume Trader
Integrates Money Flow Index and relative-volume analysis.
🌐 Higher-Timeframe Intelligence
16 — Diamond HTF
Measures directional agreement using confirmed higher-timeframe data.
17 — AtroNox VWAP
Combines VWAP, RSI, and moving-average trend information.
These engines use separately formulated analytical rules. They are not claimed to be exact mathematical reproductions of other published indicators.
━━━━━━━━━━━━━━━━━━━━
📊 3. Adaptive Market Consensus
God Mode X continuously evaluates the balance between bullish and bearish technical evidence.
The consensus framework considers:
• Directional strength and momentum
• Trend alignment and market regime
• Market structure and liquidity conditions
• Volatility and estimated volume behavior
• Higher-timeframe directional agreement
• Engine contribution and relative weighting
The dashboard displays the resulting analytical measurements so traders can identify whether conditions favor bullish, bearish, or mixed interpretations.
Because multiple engines use related price inputs, their votes should not be treated as statistically independent evidence.
━━━━━━━━━━━━━━━━━━━━
🎯 4. Confirmed Buy and Sell Signals
God Mode X generates LONG and SHORT observations when its configured analytical requirements are satisfied.
🟢 LONG Setup
A bullish signal may occur when a qualifying price-action trigger aligns with sufficient bullish consensus, trend conditions, and applicable filters.
🔴 SHORT Setup
A bearish signal may occur when a qualifying bearish trigger aligns with sufficient bearish consensus and the selected confirmation requirements.
Additional filters include:
• Minimum analytical score
• Directional score difference
• Market regime restrictions
• EMA trend alignment
• Engine breadth confirmation
• Signal cooldown periods
Signals are confirmed after the chart candle closes.
Signals represent technical observations, not guaranteed future market direction.
━━━━━━━━━━━━━━━━━━━━
💎 5. Smart Money Concepts and Liquidity
The indicator includes several price-action analysis tools.
🔹 BOS — Break of Structure
Identifies confirmed price breaks beyond established swing references.
🔹 CHoCH — Change of Character
Highlights qualifying structural breaks against the previously recorded market direction.
🔹 Liquidity Sweeps
Detects price movement beyond confirmed swing levels followed by a close back across those levels.
🔹 Fair Value Gaps
Highlights qualifying three-candle price gaps and monitors their subsequent interaction with price.
🔹 Supply and Demand Zones
Displays selected displacement-origin reference zones associated with market-structure events.
These calculations analyze observable price behavior. They do not reveal actual institutional order positions or hidden market liquidity.
━━━━━━━━━━━━━━━━━━━━
🌐 6. Multi-Timeframe Analysis
God Mode X supports two configurable higher-timeframe references.
The system evaluates previously completed higher-timeframe candles to provide additional trend context.
Traders can compare current market conditions with broader directional movements.
For proper operation, the selected higher timeframes should be greater than the active chart timeframe.
━━━━━━━━━━━━━━━━━━━━
📉 7. Estimated Volume Distribution
The indicator includes a right-edge volume-distribution visualization.
Using historical candle ranges and volume data, it estimates how traded volume may be distributed across selected price intervals.
The display includes:
• Estimated Point of Control (POC)
• Estimated Value Area High (VAH)
• Estimated Value Area Low (VAL)
• Relative volume-distribution levels
Important: This is an OHLCV-based approximation, not a true tick-level volume profile, exchange footprint, or order-book measurement.
━━━━━━━━━━━━━━━━━━━━
🖥️ 8. Advanced Intelligence Dashboard
God Mode X features a multi-section analytical dashboard designed to organize complex market information into a single visual interface.
The dashboard includes:
🟢 Bullish and bearish consensus scores
📈 Trend direction and market regime
📊 Individual engine contributions
🌐 Higher-timeframe context
⚡ Momentum and volatility measurements
💎 Market structure and liquidity observations
🎯 Illustrative trade reference levels
An additional engine matrix provides visibility into the directional measurements and relative weights of all 17 modules.
The eight-axis confluence radar groups selected market measurements into a compact visual summary.
These displays provide descriptive analytical information, not statistically calibrated prediction confidence.
━━━━━━━━━━━━━━━━━━━━
✨ 9. Advanced Chart Visualization
God Mode X includes customizable visual elements designed to make complex market information easier to interpret.
Available features include:
• Adaptive neon trend clouds
• Dynamic candle coloring
• Statistical price ribbons
• Spectral-style volatility envelopes
• Market-structure labels
• Supply and demand zones
• Liquidity reference levels
• Interactive-looking chart diagnostics
• Tick-driven dashboard visual updates
The visual style is inspired by modern analytical dashboards.
Terms such as spectral and quantum-style refer to mathematical descriptions and graphical presentation. They do not imply quantum computing or independently trained AI prediction.
Realtime visual elements update only when TradingView processes new market data.
━━━━━━━━━━━━━━━━━━━━
🛡️ 10. Risk and Reward Visualizer
After a confirmed signal, the indicator can display an illustrative trading setup.
The reference geometry includes:
🎯 Entry reference — Based on the confirmed signal candle.
🔴 Stop Loss — Calculated using a configurable ATR multiplier.
🟢 Take Profit 1 — First configurable reward multiple.
🔵 Take Profit 2 — Second configurable reward multiple.
Traders can adjust the ATR distance, target multiples, and visual projection width.
The system also monitors whether later candles touch selected reference levels.
When both stop and target are touched within the same candle, the outcome is marked as ambiguous because OHLC data cannot establish the exact sequence.
This feature is not a TradingView Strategy Tester backtest and does not represent actual trade execution.
━━━━━━━━━━━━━━━━━━━━
🔔 11. Smart Alert System
God Mode X includes configurable notifications for important analytical events.
Available alerts include:
• Confirmed bullish setups
• Confirmed bearish setups
• Either directional signal
• Market-structure breaks
• Liquidity sweep events
Selected alerts can include analytical scores and illustrative risk levels.
Alerts provide informational notifications and do not independently execute trades.
━━━━━━━━━━━━━━━━━━━━
🚀 12. How to Use God Mode X
Step 1 — Add the indicator to a standard candlestick chart.
Step 2 — Configure the two higher-timeframe references.
Step 3 — Observe the prevailing market regime and directional consensus.
Step 4 — Review the individual engine matrix to identify supporting and conflicting analytical evidence.
Step 5 — Evaluate confirmed LONG or SHORT setups in the context of market structure and volatility.
Step 6 — Review the illustrative stop-loss and target references.
Step 7 — Adjust the indicator settings to match the instrument and timeframe being analyzed.
For initial evaluation, begin with the default settings and observe signal behavior across different market conditions.
Independent historical testing and forward observation are recommended.
━━━━━━━━━━━━━━━━━━━━
🔬 13. Research and Originality
The main contribution of God Mode X is its unified implementation of 17 technical analysis categories within an adaptive weighted-consensus framework.
The indicator combines directional scoring, market-regime adjustments, analytical transparency, price-action structures, volatility measurements, and integrated chart diagnostics.
Its purpose is to reduce the need to manage numerous separate analytical tools while preserving visibility into their individual contributions.
Reference materials used during development included scripts carrying copyright notices attributed to raptoralgo.
The modules presented here use separately formulated calculations and are not described as mathematically equivalent copies of those references.
Any third-party code incorporated into a published version must comply with applicable licensing, attribution, and TradingView publication requirements.
━━━━━━━━━━━━━━━━━━━━
⚠️ 14. Important Technical Limitations
Please consider the following before using the indicator:
• Technical consensus scores are not trading success probabilities.
• Related analytical engines can produce correlated measurements.
• Volume flow calculations may use candle-derived approximations rather than actual trade delta.
• Estimated volume distribution is not exchange-level volume-at-price data.
• Swing structures require additional confirmation candles.
• Live dashboard values can change while the current candle is developing.
• Historical signal observations do not guarantee identical future market behavior.
• Illustrative trade outcomes do not account for commissions, spreads, slippage, or actual execution conditions.
• Market characteristics and available data can affect indicator calculations.
No analytical system can predict every market movement or eliminate financial risk.
━━━━━━━━━━━━━━━━━━━━
📚 15. Educational Purpose and Disclaimer
DrFX God Mode X is intended for technical analysis, educational purposes, and independent market research.
The indicator does not provide personalized investment advice, guaranteed signals, or promises of profitability.
All market participants should independently evaluate trading opportunities and apply appropriate risk-management practices.
Past hypothetical observations do not guarantee future performance.
━━━━━━━━━━━━━━━━━━━━
Developed by DrFXAi
Fusion17 Adaptive Consensus | Pine Script v6

Haftungsausschluss
Die Informationen und Veröffentlichungen sind nicht als Finanz-, Anlage-, Handels- oder andere Arten von Ratschlägen oder Empfehlungen gedacht, die von TradingView bereitgestellt oder gebilligt werden, und stellen diese nicht dar. Lesen Sie mehr in den Nutzungsbedingungen.
Haftungsausschluss
Die Informationen und Veröffentlichungen sind nicht als Finanz-, Anlage-, Handels- oder andere Arten von Ratschlägen oder Empfehlungen gedacht, die von TradingView bereitgestellt oder gebilligt werden, und stellen diese nicht dar. Lesen Sie mehr in den Nutzungsbedingungen.