Sage Trend (RichPole)
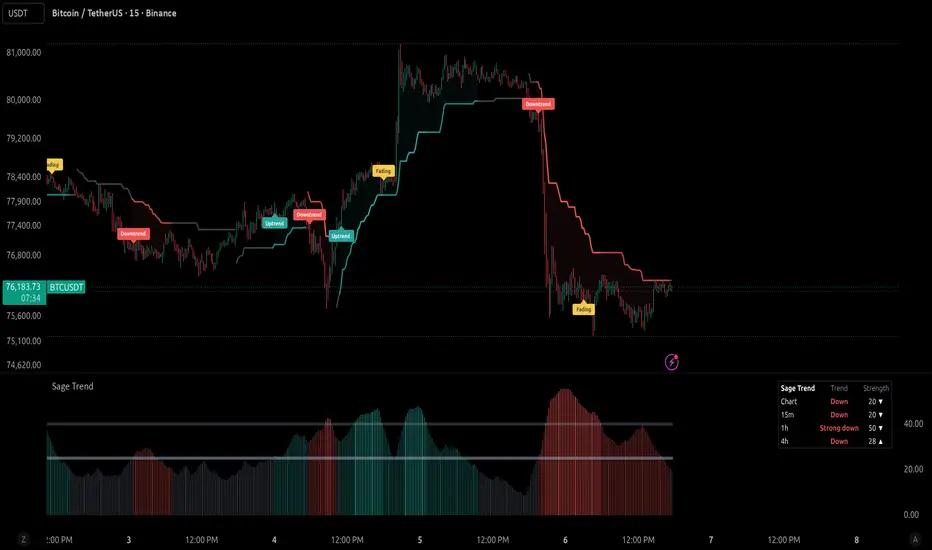
Sage Trend tells you what kind of market you are in: up trend, down trend, or no trend. It combines a trend line for direction with ADX for strength, colours both only when they agree, and prints one-word notes on the price chart. A small map shows the same reading on higher timeframes.
HOW IT WORKS
- Direction: an ATR trend line on the price chart (default 4 x ATR 10). It sits under price in an up move and above price in a down move, and it flips only when a candle closes through it.
- Strength: ADX (J. Welles Wilder, 1978) measures how strong the move is, not its direction.
- A trend counts when ADX rises above 25 and is still rising, and the line has been on its new side for at least 2 closed candles. It stops counting when ADX falls below 20 (the gap stops on/off flicker) or when the line flips.
- Colours: green line = up trend with strength, red line = down trend with strength, grey line = there is a direction but not enough strength (no trend). A light fill between price and the line shows active trends. The pane shows ADX as columns in the same colours, with level lines at 25 and 40.
- Notes: Uptrend / Downtrend print once per trend leg, when direction and strength first agree. A flip guard blocks an opposite note within 20 bars of the last one, so quick whipsaws do not stack notes on top of each other (the line still changes colour). Fading prints once per leg after the trend has built strength (ADX rose at least 5 points after the note and reached 35) and then dropped 8 points from its peak. An optional No trend note marks when strength falls below 20.
- Trend map (top right of the pane): the same logic on three higher timeframes (default 15m, 1h, 4h) plus the chart, with the ADX value and whether it is rising or falling. Higher-timeframe values come from the last closed bar of that timeframe, so they do not repaint.
WHAT IS ORIGINAL
Trend lines based on ATR and Wilder's ADX are both standard tools. This script combines them with a clear rule set: direction from the line, permission from rising ADX, one note per trend leg, a 20-bar flip guard, a strength-built Fading rule, colours that show "no trend" instead of hiding it, and a closed-bar multi-timeframe map that uses the same logic. In our tests on gold and EURUSD (2010-2026) this gave about 1 trend note per day on 15-minute charts, with opposite notes within 20 bars in about 1% of cases.
HOW TO USE IT
Use it to choose a playbook, not as a buy or sell signal:
- Uptrend / Downtrend: follow the trend, look for pullbacks toward the line, avoid fighting the move.
- Grey (no trend): range rules, trade the edges of the range back toward the middle.
- Fading: the trend is losing power. Stop adding, tighten risk, wait for the next note. Fading does not mean reverse.
- Trend map: when the timeframes agree, conditions are clearer; when they disagree (for example 15m up, 4h down), trade smaller or wait.
SETTINGS
Line distance and ATR length, ADX length, start / end / strong levels, minimum bars on the new side, flip guard, Fading rules, which notes to show, line, fill, pane levels, optional candle colouring, trend map timeframes and position, colours.
Alerts (on candle close): uptrend, downtrend, fading, no trend, trend line flip.
LIMITATIONS
- Direction and strength describe the present, not the future. In our own test on gold and EURUSD, price went 1 ATR in the noted direction first about 48-50% of the time, so use it to choose rules, not to predict.
- ADX and the trend line are smoothed and confirmed on closed candles, so notes come after a move has started, and a note can still appear near the end of a move.
- Educational tool. It does not place trades and is not financial advice.
HOW IT WORKS
- Direction: an ATR trend line on the price chart (default 4 x ATR 10). It sits under price in an up move and above price in a down move, and it flips only when a candle closes through it.
- Strength: ADX (J. Welles Wilder, 1978) measures how strong the move is, not its direction.
- A trend counts when ADX rises above 25 and is still rising, and the line has been on its new side for at least 2 closed candles. It stops counting when ADX falls below 20 (the gap stops on/off flicker) or when the line flips.
- Colours: green line = up trend with strength, red line = down trend with strength, grey line = there is a direction but not enough strength (no trend). A light fill between price and the line shows active trends. The pane shows ADX as columns in the same colours, with level lines at 25 and 40.
- Notes: Uptrend / Downtrend print once per trend leg, when direction and strength first agree. A flip guard blocks an opposite note within 20 bars of the last one, so quick whipsaws do not stack notes on top of each other (the line still changes colour). Fading prints once per leg after the trend has built strength (ADX rose at least 5 points after the note and reached 35) and then dropped 8 points from its peak. An optional No trend note marks when strength falls below 20.
- Trend map (top right of the pane): the same logic on three higher timeframes (default 15m, 1h, 4h) plus the chart, with the ADX value and whether it is rising or falling. Higher-timeframe values come from the last closed bar of that timeframe, so they do not repaint.
WHAT IS ORIGINAL
Trend lines based on ATR and Wilder's ADX are both standard tools. This script combines them with a clear rule set: direction from the line, permission from rising ADX, one note per trend leg, a 20-bar flip guard, a strength-built Fading rule, colours that show "no trend" instead of hiding it, and a closed-bar multi-timeframe map that uses the same logic. In our tests on gold and EURUSD (2010-2026) this gave about 1 trend note per day on 15-minute charts, with opposite notes within 20 bars in about 1% of cases.
HOW TO USE IT
Use it to choose a playbook, not as a buy or sell signal:
- Uptrend / Downtrend: follow the trend, look for pullbacks toward the line, avoid fighting the move.
- Grey (no trend): range rules, trade the edges of the range back toward the middle.
- Fading: the trend is losing power. Stop adding, tighten risk, wait for the next note. Fading does not mean reverse.
- Trend map: when the timeframes agree, conditions are clearer; when they disagree (for example 15m up, 4h down), trade smaller or wait.
SETTINGS
Line distance and ATR length, ADX length, start / end / strong levels, minimum bars on the new side, flip guard, Fading rules, which notes to show, line, fill, pane levels, optional candle colouring, trend map timeframes and position, colours.
Alerts (on candle close): uptrend, downtrend, fading, no trend, trend line flip.
LIMITATIONS
- Direction and strength describe the present, not the future. In our own test on gold and EURUSD, price went 1 ATR in the noted direction first about 48-50% of the time, so use it to choose rules, not to predict.
- ADX and the trend line are smoothed and confirmed on closed candles, so notes come after a move has started, and a note can still appear near the end of a move.
- Educational tool. It does not place trades and is not financial advice.

Haftungsausschluss
Die Informationen und Veröffentlichungen sind nicht als Finanz-, Anlage-, Handels- oder andere Arten von Ratschlägen oder Empfehlungen gedacht, die von TradingView bereitgestellt oder gebilligt werden, und stellen diese nicht dar. Lesen Sie mehr in den Nutzungsbedingungen.
Haftungsausschluss
Die Informationen und Veröffentlichungen sind nicht als Finanz-, Anlage-, Handels- oder andere Arten von Ratschlägen oder Empfehlungen gedacht, die von TradingView bereitgestellt oder gebilligt werden, und stellen diese nicht dar. Lesen Sie mehr in den Nutzungsbedingungen.