OPEN-SOURCE SCRIPT
Delta Flow Ribbon [AlgoNorth]
Delta Flow Ribbon
Picture two bars with the same heavy volume. In one, price travels the way that volume was leaning. In the other, it barely moves. A volume histogram draws them the same height. Delta Flow Ribbon is built to tell them apart.
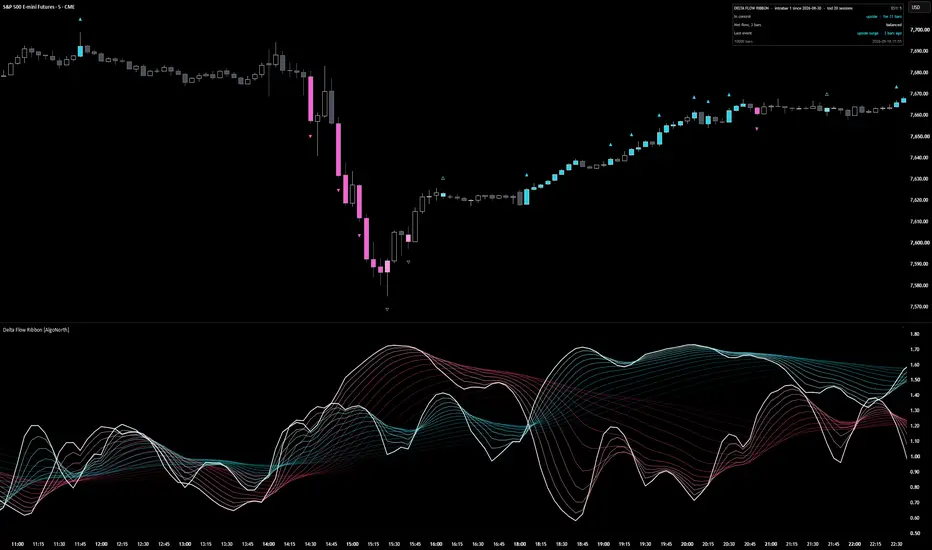
It starts with which way the volume was leaning. Two 14‑strand ribbons, blue for upside flow and pink for downside, each measured against what is normal for that exact time of day. Whichever ribbon sits on top is in control, and the fan opening or closing shows whether that control is building or fading.
The flow behind the ribbons is estimated volume delta: volume with a direction. The script looks at the 1‑minute bars inside every chart bar. Each one's volume counts as upside if it closed up, and downside if it closed down.
Then it checks whether the push worked. Candles light up where flow surges (net flow at least 2.0× normal over three bars, with price travelling with it) and where a hard push stalls (at least 1.5× normal with price travelling 0.35× or less of what that flow would usually move it). Blue for upside, pink for downside, and a lighter shade where the flow was absorbed.
It is a context tool for your own setups. It shows who is in control and when that control is being tested. It does not say what price does next.
🔶 USAGE
🔸 Start with the ribbons. Blue on top means upside flow is running ahead of downside; pink on top means downside is ahead. The bright line on top of each ribbon is its core, the quickest strand. Where the two cores cross, control has changed hands. A ribbon spread wide is flow on the move; a ribbon pulled tight is flow that has settled.
🔸 Then look up at the candles. A solid ▲ above a blue candle marks the start of an upside surge, a solid ▼ below a pink candle, the start of a downside one. A hollow △ or ▽ on a lighter candle marks absorbed flow: a heavy push went in and price barely moved. One arrow per run keeps the chart clean, and the run continues for as long as the candles stay coloured.
🔸 The candles come first and the ribbon confirms. The ribbon is smoothed over 5 to 30 bars, so its peak lands a few bars after the last coloured candle. Read the candle as the event and the ribbon as how much flow has built up behind it (the smoothing can be lowered in the settings for a quicker reaction).
🔸 The sequence worth learning: pink surge candles into a low, a light‑pink absorbed candle at the bottom, then the blue core rising up through the pink. Heavy downside flow met size, then upside flow took over. Weigh it against your own levels. It is context, not a trigger.
🔸 Price climbing while the blue ribbon slides back towards 1.0 is a move running on less flow than it started with. Price flat while a ribbon stays high is flow being soaked up. Both ribbons near 1.0 means nobody is pushing.
🔸 The panel reads the most recent bar, not the part of the chart you have scrolled to: who is in control and for how long, net flow over the last three bars, and the last event. On a live bar it says "forming now" until the bar closes. Full mode adds the raw readings, the delta source and running counts.
🔸 One thing that surprises people: the 09:30 open often shows no coloured candles at all. That is deliberate. Every bar is compared with the average for that same time of day over the last 20 sessions, so heavy flow at the open is just average for the open. A candle only colours when its flow is well above the average for its time of day.
🔶 DETAILS
🔸 Estimated delta. Each chart bar is split into its 1‑minute bars (5‑minute on charts above an hour, hourly on daily). A 1‑minute bar that closed above the previous close puts its volume into upside flow, one that closed below puts it into downside, and an unchanged close keeps the previous direction. Add them up and that is the bar's estimated delta. Where that smaller data is not available, the script places volume by where the close sits in the bar's range instead, and the panel says so.
🔸 Normal for the time of day. Volume, upside flow, downside flow and close‑to‑close travel are each averaged per time slot over the previous 20 sessions. A 5‑minute chart has 288 slots a day, and each one only ever compares itself with its own history. On charts above four hours, or until a slot has enough history, a rolling 300‑bar average takes over and the panel header shows which is in use.
🔸 The ribbons. Upside flow divided by its normal feeds the blue ribbon, downside flow divided by its normal feeds the pink. 1.0 is normal, and each side is measured up to 5×. Every ribbon is the same reading drawn at 14 smoothing lengths spaced from 5 to 30 bars, each passed through three rounds of exponential smoothing, which is what makes the fan open and close. Bars trading under 0.6× normal volume are eased back towards 1.0 so thin trade cannot throw the ribbons around.
🔸 Surge. Net flow = the 3‑bar average of delta ÷ the average one‑way flow for that time of day. A surge is net flow of at least 2.0×, with price travelling in the flow's direction.
🔸 Absorbed flow. Net flow of at least 1.5×, but the 3‑bar price change ÷ the average price change for that time of day comes to 0.35× or less of what that much flow should produce. Expected travel grows with roughly the square root of flow (exponent 0.5): four times the flow is expected to move price about twice as far, not four times. The script measures only the mismatch. Resting size on the other side is one common reason for it, not something the script can see.
🔸 Colours adapt to the chart. Put it on a white or light‑grey background and the ribbons, candles, arrows and panel darken instead of fading out.
🔶 SETTINGS
🔸 Delta: intrabar (default) or bar shape, with the intrabar timeframe on Auto or fixed at 1, 5 or 15 minutes.
🔸 Calibration: time of day (20 sessions per slot) or recent bars (300), plus the quiet threshold (0.6× normal volume).
🔸 Look: fastest strand 5, strand span 25, three smoothing passes, 14 strands, and the two ribbon colours. The defaults are smoothed on purpose. Drop the fastest strand or the passes for a twitchier ribbon.
🔸 Candles: surge at 2.0×, absorbed at 1.5× with price response 0.35×, exponent 0.5, the two candle colours, absorbed shade, arrows once per run or on every candle, arrow size, optional glow.
🔸 Alerts: control change, flow surge and absorbed flow. Pick them as named conditions, or choose "Any alert() function call" to get all three in one alert with the symbol, timeframe and readings in the message.
🔸 Scale: soft (default), log or none, with a knee for how hard extremes are squeezed. Panel: compact or full, on the price chart or in the pane, any corner.
🔶 LIMITATIONS
🔸 The delta is an estimate. It comes from 1‑minute price direction and volume, not exchange‑reported bid and ask trades, and it will differ from a true trade‑by‑trade delta.
🔸 Intrabar history runs out. Older bars beyond it use the bar‑shape fallback, and the panel shows the date the intrabar data begins.
🔸 On a 1‑minute chart there is no smaller timeframe and too few sessions inside the 10,000‑bar window, so it runs on bar shape and the recent‑bars baseline. The panel says so.
🔸 On symbols whose feed reports tick counts rather than traded size (most spot forex and CFDs), the reading is a net tick count, not a volume delta, and the panel flags it.
🔸 The script calculates the most recent 10,000 bars. Readings above 5× normal are shown as 5×.
🔸 The forming bar updates until it closes. Everything on closed bars is fixed.
🔸 Time‑of‑day calibration needs an intraday chart of four hours or less. Daily and weekly charts use the recent‑bars window.
🔶 SUMMARY
Delta Flow Ribbon turns estimated volume delta into two things you can read at a glance. The ribbons show which side is pushing and how hard for that time of day. The candles show where that push surged or was absorbed. Blue for upside, pink for downside, lighter where the flow stalled. It marks conditions, not outcomes.
Picture two bars with the same heavy volume. In one, price travels the way that volume was leaning. In the other, it barely moves. A volume histogram draws them the same height. Delta Flow Ribbon is built to tell them apart.
It starts with which way the volume was leaning. Two 14‑strand ribbons, blue for upside flow and pink for downside, each measured against what is normal for that exact time of day. Whichever ribbon sits on top is in control, and the fan opening or closing shows whether that control is building or fading.
The flow behind the ribbons is estimated volume delta: volume with a direction. The script looks at the 1‑minute bars inside every chart bar. Each one's volume counts as upside if it closed up, and downside if it closed down.
Then it checks whether the push worked. Candles light up where flow surges (net flow at least 2.0× normal over three bars, with price travelling with it) and where a hard push stalls (at least 1.5× normal with price travelling 0.35× or less of what that flow would usually move it). Blue for upside, pink for downside, and a lighter shade where the flow was absorbed.
It is a context tool for your own setups. It shows who is in control and when that control is being tested. It does not say what price does next.
🔶 USAGE
🔸 Start with the ribbons. Blue on top means upside flow is running ahead of downside; pink on top means downside is ahead. The bright line on top of each ribbon is its core, the quickest strand. Where the two cores cross, control has changed hands. A ribbon spread wide is flow on the move; a ribbon pulled tight is flow that has settled.
🔸 Then look up at the candles. A solid ▲ above a blue candle marks the start of an upside surge, a solid ▼ below a pink candle, the start of a downside one. A hollow △ or ▽ on a lighter candle marks absorbed flow: a heavy push went in and price barely moved. One arrow per run keeps the chart clean, and the run continues for as long as the candles stay coloured.
🔸 The candles come first and the ribbon confirms. The ribbon is smoothed over 5 to 30 bars, so its peak lands a few bars after the last coloured candle. Read the candle as the event and the ribbon as how much flow has built up behind it (the smoothing can be lowered in the settings for a quicker reaction).
🔸 The sequence worth learning: pink surge candles into a low, a light‑pink absorbed candle at the bottom, then the blue core rising up through the pink. Heavy downside flow met size, then upside flow took over. Weigh it against your own levels. It is context, not a trigger.
🔸 Price climbing while the blue ribbon slides back towards 1.0 is a move running on less flow than it started with. Price flat while a ribbon stays high is flow being soaked up. Both ribbons near 1.0 means nobody is pushing.
🔸 The panel reads the most recent bar, not the part of the chart you have scrolled to: who is in control and for how long, net flow over the last three bars, and the last event. On a live bar it says "forming now" until the bar closes. Full mode adds the raw readings, the delta source and running counts.
🔸 One thing that surprises people: the 09:30 open often shows no coloured candles at all. That is deliberate. Every bar is compared with the average for that same time of day over the last 20 sessions, so heavy flow at the open is just average for the open. A candle only colours when its flow is well above the average for its time of day.
🔶 DETAILS
🔸 Estimated delta. Each chart bar is split into its 1‑minute bars (5‑minute on charts above an hour, hourly on daily). A 1‑minute bar that closed above the previous close puts its volume into upside flow, one that closed below puts it into downside, and an unchanged close keeps the previous direction. Add them up and that is the bar's estimated delta. Where that smaller data is not available, the script places volume by where the close sits in the bar's range instead, and the panel says so.
🔸 Normal for the time of day. Volume, upside flow, downside flow and close‑to‑close travel are each averaged per time slot over the previous 20 sessions. A 5‑minute chart has 288 slots a day, and each one only ever compares itself with its own history. On charts above four hours, or until a slot has enough history, a rolling 300‑bar average takes over and the panel header shows which is in use.
🔸 The ribbons. Upside flow divided by its normal feeds the blue ribbon, downside flow divided by its normal feeds the pink. 1.0 is normal, and each side is measured up to 5×. Every ribbon is the same reading drawn at 14 smoothing lengths spaced from 5 to 30 bars, each passed through three rounds of exponential smoothing, which is what makes the fan open and close. Bars trading under 0.6× normal volume are eased back towards 1.0 so thin trade cannot throw the ribbons around.
🔸 Surge. Net flow = the 3‑bar average of delta ÷ the average one‑way flow for that time of day. A surge is net flow of at least 2.0×, with price travelling in the flow's direction.
🔸 Absorbed flow. Net flow of at least 1.5×, but the 3‑bar price change ÷ the average price change for that time of day comes to 0.35× or less of what that much flow should produce. Expected travel grows with roughly the square root of flow (exponent 0.5): four times the flow is expected to move price about twice as far, not four times. The script measures only the mismatch. Resting size on the other side is one common reason for it, not something the script can see.
🔸 Colours adapt to the chart. Put it on a white or light‑grey background and the ribbons, candles, arrows and panel darken instead of fading out.
🔶 SETTINGS
🔸 Delta: intrabar (default) or bar shape, with the intrabar timeframe on Auto or fixed at 1, 5 or 15 minutes.
🔸 Calibration: time of day (20 sessions per slot) or recent bars (300), plus the quiet threshold (0.6× normal volume).
🔸 Look: fastest strand 5, strand span 25, three smoothing passes, 14 strands, and the two ribbon colours. The defaults are smoothed on purpose. Drop the fastest strand or the passes for a twitchier ribbon.
🔸 Candles: surge at 2.0×, absorbed at 1.5× with price response 0.35×, exponent 0.5, the two candle colours, absorbed shade, arrows once per run or on every candle, arrow size, optional glow.
🔸 Alerts: control change, flow surge and absorbed flow. Pick them as named conditions, or choose "Any alert() function call" to get all three in one alert with the symbol, timeframe and readings in the message.
🔸 Scale: soft (default), log or none, with a knee for how hard extremes are squeezed. Panel: compact or full, on the price chart or in the pane, any corner.
🔶 LIMITATIONS
🔸 The delta is an estimate. It comes from 1‑minute price direction and volume, not exchange‑reported bid and ask trades, and it will differ from a true trade‑by‑trade delta.
🔸 Intrabar history runs out. Older bars beyond it use the bar‑shape fallback, and the panel shows the date the intrabar data begins.
🔸 On a 1‑minute chart there is no smaller timeframe and too few sessions inside the 10,000‑bar window, so it runs on bar shape and the recent‑bars baseline. The panel says so.
🔸 On symbols whose feed reports tick counts rather than traded size (most spot forex and CFDs), the reading is a net tick count, not a volume delta, and the panel flags it.
🔸 The script calculates the most recent 10,000 bars. Readings above 5× normal are shown as 5×.
🔸 The forming bar updates until it closes. Everything on closed bars is fixed.
🔸 Time‑of‑day calibration needs an intraday chart of four hours or less. Daily and weekly charts use the recent‑bars window.
🔶 SUMMARY
Delta Flow Ribbon turns estimated volume delta into two things you can read at a glance. The ribbons show which side is pushing and how hard for that time of day. The candles show where that push surged or was absorbed. Blue for upside, pink for downside, lighter where the flow stalled. It marks conditions, not outcomes.
Open-source Skript
Ganz im Sinne von TradingView hat dieser Autor sein/ihr Script als Open-Source veröffentlicht. Auf diese Weise können nun auch andere Trader das Script rezensieren und die Funktionalität überprüfen. Vielen Dank an den Autor! Sie können das Script kostenlos verwenden, aber eine Wiederveröffentlichung des Codes unterliegt unseren Hausregeln.

Haftungsausschluss
Die Informationen und Veröffentlichungen sind nicht als Finanz-, Anlage-, Handels- oder andere Arten von Ratschlägen oder Empfehlungen gedacht, die von TradingView bereitgestellt oder gebilligt werden, und stellen diese nicht dar. Lesen Sie mehr in den Nutzungsbedingungen.
Open-source Skript
Ganz im Sinne von TradingView hat dieser Autor sein/ihr Script als Open-Source veröffentlicht. Auf diese Weise können nun auch andere Trader das Script rezensieren und die Funktionalität überprüfen. Vielen Dank an den Autor! Sie können das Script kostenlos verwenden, aber eine Wiederveröffentlichung des Codes unterliegt unseren Hausregeln.
Haftungsausschluss
Die Informationen und Veröffentlichungen sind nicht als Finanz-, Anlage-, Handels- oder andere Arten von Ratschlägen oder Empfehlungen gedacht, die von TradingView bereitgestellt oder gebilligt werden, und stellen diese nicht dar. Lesen Sie mehr in den Nutzungsbedingungen.