OPEN-SOURCE SCRIPT
EMA + VWAP + Bollinger Bands Combo
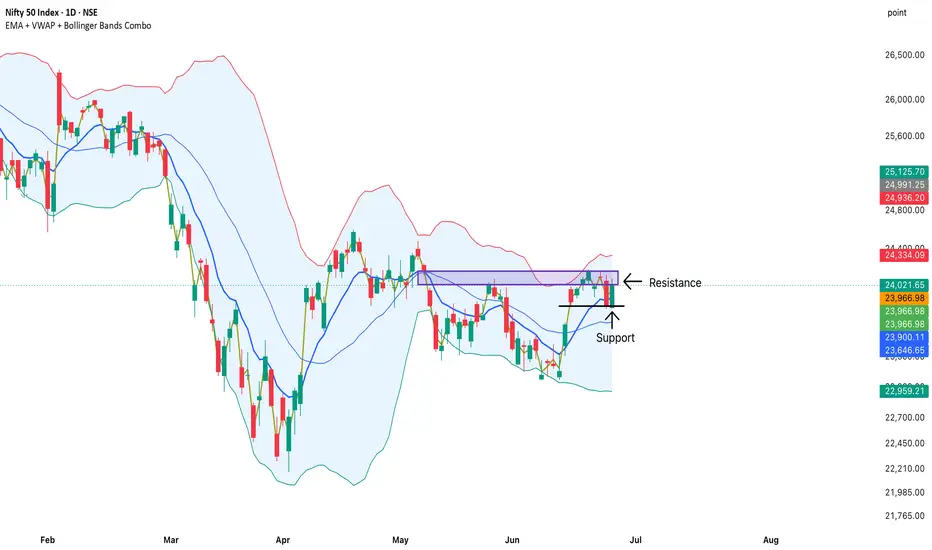
# EMA + VWAP + Bollinger Bands Combo
This indicator combines three of the most popular technical analysis tools into a single customizable overlay: Exponential Moving Average (EMA), Volume Weighted Average Price (VWAP), and Bollinger Bands.
Instead of adding multiple indicators to your chart, you can manage all three from a single script and enable only the tools you need.
### Features
✅ **Exponential Moving Average (EMA)**
* Customizable length and source
* Optional display toggle
* Useful for identifying trend direction and dynamic support/resistance
✅ **Volume Weighted Average Price (VWAP)**
* Supports Session, Weekly, Monthly, Quarterly, and Yearly anchors
* Optional VWAP deviation bands
* Useful for institutional price analysis and intraday trend confirmation
✅ **Bollinger Bands**
* Customizable length and standard deviation settings
* Supports SMA, EMA, RMA (SMMA), WMA, and VWMA as the basis
* Useful for volatility analysis, breakout detection, and mean-reversion setups
### Display Combinations
The indicator allows any combination of:
* EMA only
* VWAP only
* Bollinger Bands only
* EMA + VWAP
* EMA + Bollinger Bands
* VWAP + Bollinger Bands
* EMA + VWAP + Bollinger Bands
### How Traders Commonly Use It
**Trend Following**
* Price above EMA and VWAP can indicate bullish conditions.
* Price below EMA and VWAP can indicate bearish conditions.
**Intraday Trading**
* VWAP acts as a key institutional reference level.
* VWAP bands can help identify stretched price conditions.
**Volatility Analysis**
* Bollinger Band expansion may indicate increasing volatility.
* Bollinger Band contraction may indicate potential breakout conditions.
**Confluence Zones**
* Areas where EMA, VWAP, and Bollinger Bands align can provide stronger support and resistance levels.
### Notes
This indicator is designed as a convenience tool that combines multiple commonly used overlays into a single script, helping reduce chart clutter while maintaining flexibility and customization.
This indicator combines three of the most popular technical analysis tools into a single customizable overlay: Exponential Moving Average (EMA), Volume Weighted Average Price (VWAP), and Bollinger Bands.
Instead of adding multiple indicators to your chart, you can manage all three from a single script and enable only the tools you need.
### Features
✅ **Exponential Moving Average (EMA)**
* Customizable length and source
* Optional display toggle
* Useful for identifying trend direction and dynamic support/resistance
✅ **Volume Weighted Average Price (VWAP)**
* Supports Session, Weekly, Monthly, Quarterly, and Yearly anchors
* Optional VWAP deviation bands
* Useful for institutional price analysis and intraday trend confirmation
✅ **Bollinger Bands**
* Customizable length and standard deviation settings
* Supports SMA, EMA, RMA (SMMA), WMA, and VWMA as the basis
* Useful for volatility analysis, breakout detection, and mean-reversion setups
### Display Combinations
The indicator allows any combination of:
* EMA only
* VWAP only
* Bollinger Bands only
* EMA + VWAP
* EMA + Bollinger Bands
* VWAP + Bollinger Bands
* EMA + VWAP + Bollinger Bands
### How Traders Commonly Use It
**Trend Following**
* Price above EMA and VWAP can indicate bullish conditions.
* Price below EMA and VWAP can indicate bearish conditions.
**Intraday Trading**
* VWAP acts as a key institutional reference level.
* VWAP bands can help identify stretched price conditions.
**Volatility Analysis**
* Bollinger Band expansion may indicate increasing volatility.
* Bollinger Band contraction may indicate potential breakout conditions.
**Confluence Zones**
* Areas where EMA, VWAP, and Bollinger Bands align can provide stronger support and resistance levels.
### Notes
This indicator is designed as a convenience tool that combines multiple commonly used overlays into a single script, helping reduce chart clutter while maintaining flexibility and customization.
Open-source Skript
Ganz im Sinne von TradingView hat dieser Autor sein/ihr Script als Open-Source veröffentlicht. Auf diese Weise können nun auch andere Trader das Script rezensieren und die Funktionalität überprüfen. Vielen Dank an den Autor! Sie können das Script kostenlos verwenden, aber eine Wiederveröffentlichung des Codes unterliegt unseren Hausregeln.

Haftungsausschluss
Die Informationen und Veröffentlichungen sind nicht als Finanz-, Anlage-, Handels- oder andere Arten von Ratschlägen oder Empfehlungen gedacht, die von TradingView bereitgestellt oder gebilligt werden, und stellen diese nicht dar. Lesen Sie mehr in den Nutzungsbedingungen.
Open-source Skript
Ganz im Sinne von TradingView hat dieser Autor sein/ihr Script als Open-Source veröffentlicht. Auf diese Weise können nun auch andere Trader das Script rezensieren und die Funktionalität überprüfen. Vielen Dank an den Autor! Sie können das Script kostenlos verwenden, aber eine Wiederveröffentlichung des Codes unterliegt unseren Hausregeln.
Haftungsausschluss
Die Informationen und Veröffentlichungen sind nicht als Finanz-, Anlage-, Handels- oder andere Arten von Ratschlägen oder Empfehlungen gedacht, die von TradingView bereitgestellt oder gebilligt werden, und stellen diese nicht dar. Lesen Sie mehr in den Nutzungsbedingungen.