PivotTrendlines
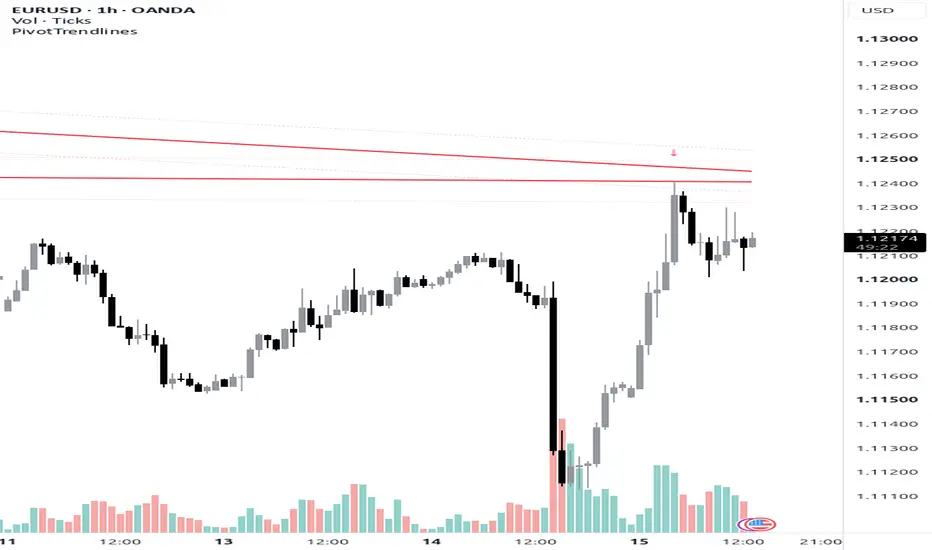
PivotTrendlines is a library that finds and draws trendlines automatically from swing pivots, so other scripts can build trendline-based tools without re-implementing the geometry.
How it works
• You pass an array of pivot points (pivot highs for resistances, pivot lows for supports), ordered from oldest to newest.
• Strong trendlines are made of three pivots: the third pivot must sit inside a tolerance channel around the line drawn through the first two. Resistances need descending (or equal) highs, supports rising (or equal) lows.
• Weak trendlines are made of two pivots and exclude pairs already used by a strong trendline.
• A line is kept only if no candle body has closed beyond it (plus the tolerance) since its first point. Optionally, the line is also checked when extended to the left ("pastCandle").
• Results are sorted by distance to the current price: the first element is the nearest line.
Exported types
• PivotPoint: barTime (bar index of the pivot, not a timestamp) and price.
• Trendline: pointA, pointB, optional pointC (na for weak lines) and currentPrice (line value on the bar where it was computed).
Exported functions
• getStrongResistances / getStrongSupports(pivotPoints, minBar, maxBarCandle, maxBar, percentage, pastCandle)
• getWeakResistances / getWeakSupports(strongTrendlines, pivotPoints, minBar, maxBarCandle, maxBar, percentage, pastCandle)
• drawTrendline(trendline, channelSize, channelColor, arrowText, arrowColor, arrowPosition, lineStyle, lineColor, lineExtend): draws the line, its dotted tolerance channel and a label on each pivot; returns the labels and lines so you can delete them.
• getCurrentTrendlinePoint(pointA, pointB): projects a line onto the current bar.
• trendlineIsBroken(trendline, minBar, trendlineType, channelSize, strict): close beyond the line.
• trendlineIsTouched / trendlineIsRejected / chanelIsTouched(...): wick touch, rejection and channel touch on the current bar.
Parameters
• minBar / maxBarCandle: minimum and maximum number of bars between two consecutive points of a line.
• maxBar: maximum age, in bars, of the first point.
• percentage: tolerance in price units (half-width of the channel). A practical value is a few percent of the recent range, for example (ta.highest(high, 500) - ta.lowest(low, 500)) / 100 * 2.
• trendlineType: "resistance" or "support".
Example
//version=6
indicator("Trendline example", overlay = true, max_bars_back = 500)
import ricardo313/PivotTrendlines/1 as tl
var highs = array.new<tl.PivotPoint>()
ph = ta.pivothigh(5, 5)
if not na(ph)
highs.push(tl.PivotPoint.new(bar_index - 5, ph))
if highs.size() > 20
highs.shift()
tolerance = (ta.highest(high, 500) - ta.lowest(low, 500)) / 100 * 2
if barstate.islast
lines = tl.getStrongResistances(highs, 10, 100, 300, tolerance, 0)
if lines.size() > 0
[lbls, lns] = tl.drawTrendline(lines.first(), tolerance, color.new(color.red, 60), "↓", color.red, yloc.abovebar, line.style_solid, color.red, extend.none)
Chart
When the library itself is added to a chart it runs a small demo: the two nearest strong resistances (red) and supports (green) found from 5-bar pivots, falling back to weak lines when no strong line exists.
Notes
• The functions loop over past bars, so the calling script may need a larger max_bars_back.
• Trendlines are recomputed from confirmed pivots; a pivot is only known "length" bars after it forms.
How it works
• You pass an array of pivot points (pivot highs for resistances, pivot lows for supports), ordered from oldest to newest.
• Strong trendlines are made of three pivots: the third pivot must sit inside a tolerance channel around the line drawn through the first two. Resistances need descending (or equal) highs, supports rising (or equal) lows.
• Weak trendlines are made of two pivots and exclude pairs already used by a strong trendline.
• A line is kept only if no candle body has closed beyond it (plus the tolerance) since its first point. Optionally, the line is also checked when extended to the left ("pastCandle").
• Results are sorted by distance to the current price: the first element is the nearest line.
Exported types
• PivotPoint: barTime (bar index of the pivot, not a timestamp) and price.
• Trendline: pointA, pointB, optional pointC (na for weak lines) and currentPrice (line value on the bar where it was computed).
Exported functions
• getStrongResistances / getStrongSupports(pivotPoints, minBar, maxBarCandle, maxBar, percentage, pastCandle)
• getWeakResistances / getWeakSupports(strongTrendlines, pivotPoints, minBar, maxBarCandle, maxBar, percentage, pastCandle)
• drawTrendline(trendline, channelSize, channelColor, arrowText, arrowColor, arrowPosition, lineStyle, lineColor, lineExtend): draws the line, its dotted tolerance channel and a label on each pivot; returns the labels and lines so you can delete them.
• getCurrentTrendlinePoint(pointA, pointB): projects a line onto the current bar.
• trendlineIsBroken(trendline, minBar, trendlineType, channelSize, strict): close beyond the line.
• trendlineIsTouched / trendlineIsRejected / chanelIsTouched(...): wick touch, rejection and channel touch on the current bar.
Parameters
• minBar / maxBarCandle: minimum and maximum number of bars between two consecutive points of a line.
• maxBar: maximum age, in bars, of the first point.
• percentage: tolerance in price units (half-width of the channel). A practical value is a few percent of the recent range, for example (ta.highest(high, 500) - ta.lowest(low, 500)) / 100 * 2.
• trendlineType: "resistance" or "support".
Example
//version=6
indicator("Trendline example", overlay = true, max_bars_back = 500)
import ricardo313/PivotTrendlines/1 as tl
var highs = array.new<tl.PivotPoint>()
ph = ta.pivothigh(5, 5)
if not na(ph)
highs.push(tl.PivotPoint.new(bar_index - 5, ph))
if highs.size() > 20
highs.shift()
tolerance = (ta.highest(high, 500) - ta.lowest(low, 500)) / 100 * 2
if barstate.islast
lines = tl.getStrongResistances(highs, 10, 100, 300, tolerance, 0)
if lines.size() > 0
[lbls, lns] = tl.drawTrendline(lines.first(), tolerance, color.new(color.red, 60), "↓", color.red, yloc.abovebar, line.style_solid, color.red, extend.none)
Chart
When the library itself is added to a chart it runs a small demo: the two nearest strong resistances (red) and supports (green) found from 5-bar pivots, falling back to weak lines when no strong line exists.
Notes
• The functions loop over past bars, so the calling script may need a larger max_bars_back.
• Trendlines are recomputed from confirmed pivots; a pivot is only known "length" bars after it forms.

Haftungsausschluss
Die Informationen und Veröffentlichungen sind nicht als Finanz-, Anlage-, Handels- oder andere Arten von Ratschlägen oder Empfehlungen gedacht, die von TradingView bereitgestellt oder gebilligt werden, und stellen diese nicht dar. Lesen Sie mehr in den Nutzungsbedingungen.
Haftungsausschluss
Die Informationen und Veröffentlichungen sind nicht als Finanz-, Anlage-, Handels- oder andere Arten von Ratschlägen oder Empfehlungen gedacht, die von TradingView bereitgestellt oder gebilligt werden, und stellen diese nicht dar. Lesen Sie mehr in den Nutzungsbedingungen.