Liquidity Sweep Buy/Sell [v6]
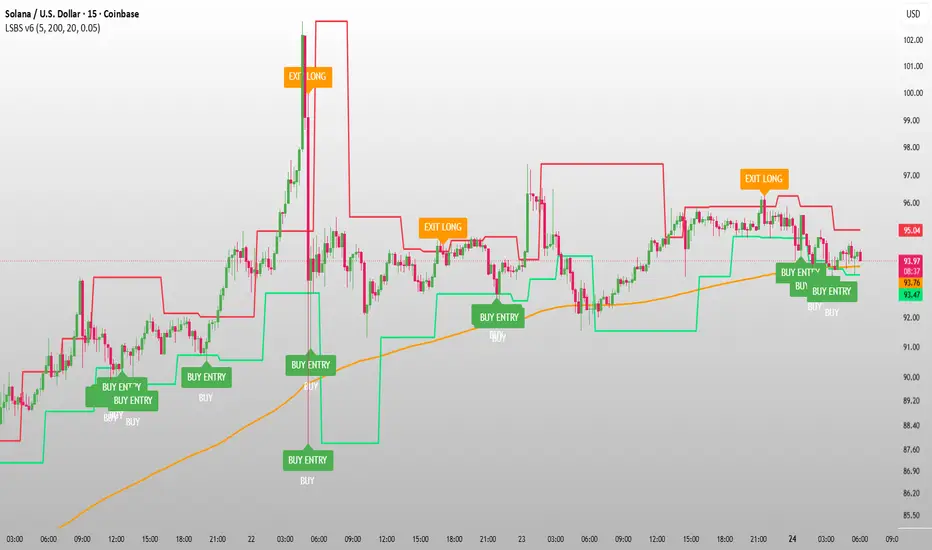
# Liquidity Sweep Buy/Sell [v6]
## Overview
**Liquidity Sweep Buy/Sell [v6]** is a price-action indicator designed to identify potential **liquidity sweeps** around important swing highs and swing lows.
The indicator looks for situations where price moves beyond a previous high or low, takes the available liquidity, and then closes back inside the previous level.
It can help traders identify potential **reversal areas, BUY/SELL opportunities, entries, and exits**.
> **Important:** This indicator is a technical analysis tool, not a guarantee of future price movement. Always use proper risk management and confirm signals with your own analysis.
---
## 🔹 What Is Liquidity?
In simple terms, **liquidity** is an area where many orders may be located.
Common liquidity areas include:
* Previous swing highs
* Previous swing lows
* Equal highs
* Equal lows
* Previous session highs/lows
* Important support and resistance levels
For example:
If price forms a previous high and later moves above that high, traders may interpret this move as a **liquidity sweep**.
If price then quickly closes back below the previous high, it can indicate that the breakout failed and that price may potentially reverse.
---
# 🟢 How the BUY Signal Works
The indicator searches for a previous swing low.
When price moves below that liquidity level and then closes back above it, the indicator can generate a **BUY signal**.
### Example:
**Previous Low → Price Sweeps Below → Price Closes Back Above → BUY**
This can indicate that sell-side liquidity below the previous low has been taken.
The indicator can then display:
**🟢 BUY**
and
**BUY ENTRY**
---
# 🔴 How the SELL Signal Works
The indicator searches for a previous swing high.
When price moves above that liquidity level and then closes back below it, the indicator can generate a **SELL signal**.
### Example:
**Previous High → Price Sweeps Above → Price Closes Back Below → SELL**
This can indicate that buy-side liquidity above the previous high has been taken.
The indicator can then display:
**🔴 SELL**
and
**SELL ENTRY**
---
# 📈 EMA Trend Filter
The indicator includes an optional **EMA Trend Filter**.
By default, it uses the **200 EMA**.
### Bullish Environment
When price is above the EMA, the indicator favors BUY signals.
### Bearish Environment
When price is below the EMA, the indicator favors SELL signals.
This filter can help reduce signals that go against the broader market direction.
You can disable the EMA filter from the settings if you want to use pure liquidity-sweep signals.
---
# 📊 Volume Filter
An optional **Volume Filter** is also available.
When enabled, the indicator compares current volume with the average volume.
This can help traders focus on liquidity sweeps that occur with relatively stronger market activity.
The volume filter is disabled by default.
---
# 🎯 How to Use the Indicator
## Step 1 — Add the Indicator
Open TradingView and add:
**Liquidity Sweep Buy/Sell [v6]**
to your chart.
---
## Step 2 — Identify the Market Trend
First look at the 200 EMA.
### Price Above EMA
Focus more on:
**🟢 BUY signals**
### Price Below EMA
Focus more on:
**🔴 SELL signals**
---
## Step 3 — Look for Liquidity
Watch the red and green liquidity levels.
### Red Level
Represents a previous swing high and potential **buy-side liquidity**.
### Green Level
Represents a previous swing low and potential **sell-side liquidity**.
---
## Step 4 — Wait for the Sweep
Do not enter simply because price touches a liquidity level.
Wait for price to **sweep the level and close back through it**.
This is the important part of the setup.
---
## Step 5 — Confirm the Signal
A stronger setup can occur when:
**Liquidity Sweep + Trend Direction + Strong Candle + Volume**
all support the same direction.
For example:
**Price above 200 EMA → price sweeps a previous low → candle closes back above the low → BUY signal**
This gives you a more structured setup instead of entering randomly.
---
# 🧠 How Beginners Can Learn It
If you are new to liquidity trading, learn these concepts in this order:
### 1. Market Structure
Learn:
* Higher High
* Higher Low
* Lower High
* Lower Low
### 2. Support & Resistance
Understand how previous highs and lows can become important areas.
### 3. Liquidity
Learn why traders watch:
* Previous highs
* Previous lows
* Equal highs
* Equal lows
### 4. Liquidity Sweeps
Understand the difference between:
**Breakout**
and
**Liquidity Sweep**
A sweep moves through a level but then returns back inside it.
### 5. Confirmation
Learn to wait for the candle close rather than entering immediately when price touches a level.
---
# 💡 Simple Strategy Example
### BUY Setup
1. Price is above the 200 EMA.
2. A previous swing low is visible.
3. Price moves below that low.
4. Price closes back above the low.
5. BUY signal appears.
6. Look for confirmation before entering.
7. Place your stop-loss according to your own risk-management rules.
8. Target a logical resistance/liquidity area.
### SELL Setup
1. Price is below the 200 EMA.
2. A previous swing high is visible.
3. Price moves above that high.
4. Price closes back below the high.
5. SELL signal appears.
6. Look for confirmation before entering.
7. Place your stop-loss according to your own risk-management rules.
8. Target a logical support/liquidity area.
---
# ⚙️ Recommended Settings
### Beginner
* Swing Length: **5**
* EMA Filter: **ON**
* EMA Length: **200**
* Volume Filter: **OFF**
### More Signals
Reduce the swing length.
For example:
**3–5**
This can make the indicator more sensitive.
### Stronger / Fewer Signals
Increase the swing length.
For example:
**7–10**
This focuses more on larger swing points.
---
# ⏱️ Timeframe
The indicator can be used on multiple timeframes.
For beginners, consider studying:
* 5-minute
* 15-minute
* 1-hour
* 4-hour
Do not assume that a signal on a lower timeframe is automatically stronger than a signal on a higher timeframe.
A useful approach is to identify the larger trend on a higher timeframe and then look for liquidity sweeps on a lower timeframe.
---
# 🚨 Important Risk Warning
No indicator can predict the market with 100% accuracy.
Liquidity sweeps can fail, especially during:
* High-impact news
* Extremely volatile markets
* Low-liquidity periods
* Strong trend continuation
* Sudden market manipulation or large orders
Always use:
**Risk Management + Stop Loss + Position Sizing + Market Analysis**
Never risk money you cannot afford to lose.
---
# 🔔 Alerts
The indicator includes TradingView alert conditions for:
* 🟢 Liquidity BUY
* 🔴 Liquidity SELL
* Exit LONG
* Exit SHORT
You can create alerts from TradingView's **Create Alert** menu after adding the indicator to your chart.
---
# 📚 How to Practice
Before using this indicator with real money, open a TradingView chart and study historical examples.
For every signal, ask yourself:
1. Where was the liquidity?
2. Did price actually sweep the level?
3. Did the candle close back through the level?
4. What was the trend?
5. Was price above or below the 200 EMA?
6. Was there strong volume?
7. Where would the stop-loss logically go?
8. Where was the next liquidity/support/resistance area?
Keep a trading journal and record both winning and losing setups.
The goal is not to take every signal.
The goal is to **understand why the signal appeared**.
---
# ⭐ Final Note
**Liquidity Sweep Buy/Sell [v6]** is designed to make liquidity-based price action easier to visualize.
Use the indicator as a **confirmation and analysis tool**, not as an automatic trading system.
The best results come from combining the indicator with:
**Market Structure + Liquidity + Trend + Confirmation + Risk Management.**
Trade smart. Protect your capital. Learn the setup before trading it live.
## Overview
**Liquidity Sweep Buy/Sell [v6]** is a price-action indicator designed to identify potential **liquidity sweeps** around important swing highs and swing lows.
The indicator looks for situations where price moves beyond a previous high or low, takes the available liquidity, and then closes back inside the previous level.
It can help traders identify potential **reversal areas, BUY/SELL opportunities, entries, and exits**.
> **Important:** This indicator is a technical analysis tool, not a guarantee of future price movement. Always use proper risk management and confirm signals with your own analysis.
---
## 🔹 What Is Liquidity?
In simple terms, **liquidity** is an area where many orders may be located.
Common liquidity areas include:
* Previous swing highs
* Previous swing lows
* Equal highs
* Equal lows
* Previous session highs/lows
* Important support and resistance levels
For example:
If price forms a previous high and later moves above that high, traders may interpret this move as a **liquidity sweep**.
If price then quickly closes back below the previous high, it can indicate that the breakout failed and that price may potentially reverse.
---
# 🟢 How the BUY Signal Works
The indicator searches for a previous swing low.
When price moves below that liquidity level and then closes back above it, the indicator can generate a **BUY signal**.
### Example:
**Previous Low → Price Sweeps Below → Price Closes Back Above → BUY**
This can indicate that sell-side liquidity below the previous low has been taken.
The indicator can then display:
**🟢 BUY**
and
**BUY ENTRY**
---
# 🔴 How the SELL Signal Works
The indicator searches for a previous swing high.
When price moves above that liquidity level and then closes back below it, the indicator can generate a **SELL signal**.
### Example:
**Previous High → Price Sweeps Above → Price Closes Back Below → SELL**
This can indicate that buy-side liquidity above the previous high has been taken.
The indicator can then display:
**🔴 SELL**
and
**SELL ENTRY**
---
# 📈 EMA Trend Filter
The indicator includes an optional **EMA Trend Filter**.
By default, it uses the **200 EMA**.
### Bullish Environment
When price is above the EMA, the indicator favors BUY signals.
### Bearish Environment
When price is below the EMA, the indicator favors SELL signals.
This filter can help reduce signals that go against the broader market direction.
You can disable the EMA filter from the settings if you want to use pure liquidity-sweep signals.
---
# 📊 Volume Filter
An optional **Volume Filter** is also available.
When enabled, the indicator compares current volume with the average volume.
This can help traders focus on liquidity sweeps that occur with relatively stronger market activity.
The volume filter is disabled by default.
---
# 🎯 How to Use the Indicator
## Step 1 — Add the Indicator
Open TradingView and add:
**Liquidity Sweep Buy/Sell [v6]**
to your chart.
---
## Step 2 — Identify the Market Trend
First look at the 200 EMA.
### Price Above EMA
Focus more on:
**🟢 BUY signals**
### Price Below EMA
Focus more on:
**🔴 SELL signals**
---
## Step 3 — Look for Liquidity
Watch the red and green liquidity levels.
### Red Level
Represents a previous swing high and potential **buy-side liquidity**.
### Green Level
Represents a previous swing low and potential **sell-side liquidity**.
---
## Step 4 — Wait for the Sweep
Do not enter simply because price touches a liquidity level.
Wait for price to **sweep the level and close back through it**.
This is the important part of the setup.
---
## Step 5 — Confirm the Signal
A stronger setup can occur when:
**Liquidity Sweep + Trend Direction + Strong Candle + Volume**
all support the same direction.
For example:
**Price above 200 EMA → price sweeps a previous low → candle closes back above the low → BUY signal**
This gives you a more structured setup instead of entering randomly.
---
# 🧠 How Beginners Can Learn It
If you are new to liquidity trading, learn these concepts in this order:
### 1. Market Structure
Learn:
* Higher High
* Higher Low
* Lower High
* Lower Low
### 2. Support & Resistance
Understand how previous highs and lows can become important areas.
### 3. Liquidity
Learn why traders watch:
* Previous highs
* Previous lows
* Equal highs
* Equal lows
### 4. Liquidity Sweeps
Understand the difference between:
**Breakout**
and
**Liquidity Sweep**
A sweep moves through a level but then returns back inside it.
### 5. Confirmation
Learn to wait for the candle close rather than entering immediately when price touches a level.
---
# 💡 Simple Strategy Example
### BUY Setup
1. Price is above the 200 EMA.
2. A previous swing low is visible.
3. Price moves below that low.
4. Price closes back above the low.
5. BUY signal appears.
6. Look for confirmation before entering.
7. Place your stop-loss according to your own risk-management rules.
8. Target a logical resistance/liquidity area.
### SELL Setup
1. Price is below the 200 EMA.
2. A previous swing high is visible.
3. Price moves above that high.
4. Price closes back below the high.
5. SELL signal appears.
6. Look for confirmation before entering.
7. Place your stop-loss according to your own risk-management rules.
8. Target a logical support/liquidity area.
---
# ⚙️ Recommended Settings
### Beginner
* Swing Length: **5**
* EMA Filter: **ON**
* EMA Length: **200**
* Volume Filter: **OFF**
### More Signals
Reduce the swing length.
For example:
**3–5**
This can make the indicator more sensitive.
### Stronger / Fewer Signals
Increase the swing length.
For example:
**7–10**
This focuses more on larger swing points.
---
# ⏱️ Timeframe
The indicator can be used on multiple timeframes.
For beginners, consider studying:
* 5-minute
* 15-minute
* 1-hour
* 4-hour
Do not assume that a signal on a lower timeframe is automatically stronger than a signal on a higher timeframe.
A useful approach is to identify the larger trend on a higher timeframe and then look for liquidity sweeps on a lower timeframe.
---
# 🚨 Important Risk Warning
No indicator can predict the market with 100% accuracy.
Liquidity sweeps can fail, especially during:
* High-impact news
* Extremely volatile markets
* Low-liquidity periods
* Strong trend continuation
* Sudden market manipulation or large orders
Always use:
**Risk Management + Stop Loss + Position Sizing + Market Analysis**
Never risk money you cannot afford to lose.
---
# 🔔 Alerts
The indicator includes TradingView alert conditions for:
* 🟢 Liquidity BUY
* 🔴 Liquidity SELL
* Exit LONG
* Exit SHORT
You can create alerts from TradingView's **Create Alert** menu after adding the indicator to your chart.
---
# 📚 How to Practice
Before using this indicator with real money, open a TradingView chart and study historical examples.
For every signal, ask yourself:
1. Where was the liquidity?
2. Did price actually sweep the level?
3. Did the candle close back through the level?
4. What was the trend?
5. Was price above or below the 200 EMA?
6. Was there strong volume?
7. Where would the stop-loss logically go?
8. Where was the next liquidity/support/resistance area?
Keep a trading journal and record both winning and losing setups.
The goal is not to take every signal.
The goal is to **understand why the signal appeared**.
---
# ⭐ Final Note
**Liquidity Sweep Buy/Sell [v6]** is designed to make liquidity-based price action easier to visualize.
Use the indicator as a **confirmation and analysis tool**, not as an automatic trading system.
The best results come from combining the indicator with:
**Market Structure + Liquidity + Trend + Confirmation + Risk Management.**
Trade smart. Protect your capital. Learn the setup before trading it live.

Free forex gold & crypto signals
t.me/LondonTradingStandards
free gold signals
t.me/+F9p2HlCBcosyMDE8
exness broker one.exnessonelink.com/a/g8y6w860c5
t.me/LondonTradingStandards
free gold signals
t.me/+F9p2HlCBcosyMDE8
exness broker one.exnessonelink.com/a/g8y6w860c5
Haftungsausschluss
Die Informationen und Veröffentlichungen sind nicht als Finanz-, Anlage-, Handels- oder andere Arten von Ratschlägen oder Empfehlungen gedacht, die von TradingView bereitgestellt oder gebilligt werden, und stellen diese nicht dar. Lesen Sie mehr in den Nutzungsbedingungen.
Free forex gold & crypto signals
t.me/LondonTradingStandards
free gold signals
t.me/+F9p2HlCBcosyMDE8
exness broker one.exnessonelink.com/a/g8y6w860c5
t.me/LondonTradingStandards
free gold signals
t.me/+F9p2HlCBcosyMDE8
exness broker one.exnessonelink.com/a/g8y6w860c5
Haftungsausschluss
Die Informationen und Veröffentlichungen sind nicht als Finanz-, Anlage-, Handels- oder andere Arten von Ratschlägen oder Empfehlungen gedacht, die von TradingView bereitgestellt oder gebilligt werden, und stellen diese nicht dar. Lesen Sie mehr in den Nutzungsbedingungen.