OPEN-SOURCE SCRIPT
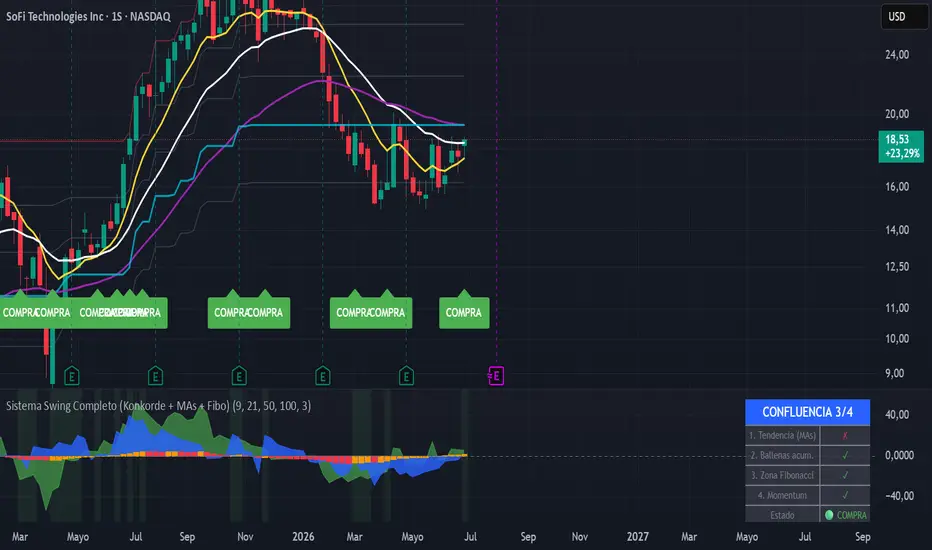
Aktualisiert Sistema Swing Completo (Konkorde + MAs + Fibo)
// This source code is subject to the terms of the Mozilla Public License 2.0
//version=6
indicator("Sistema Swing Completo (Konkorde + MAs + Fibo)", overlay=false)
// =====================================================================
// 1. KONCORDE (VOLUMEN DE BALLENAS VS MINORISTAS)
// =====================================================================
// Cálculo de PVI (Minoristas) y NVI (Ballenas)
var float pvi = 1000.0
var float nvi = 1000.0
if bar_index > 0
pvi := volume > volume[1] ? pvi[1] + ((close - close[1]) / close[1]) * pvi[1] : pvi[1]
nvi := volume < volume[1] ? nvi[1] + ((close - close[1]) / close[1]) * nvi[1] : nvi[1]
// Oscilación de Minoristas (Manos Débiles)
pvim = ta.ema(pvi, 15)
pvimax = ta.highest(pvim, 90)
pvimin = ta.lowest(pvim, 90)
minoristas = (pvi - pvim) * 100 / math.max(pvimax - pvimin, 1)
// Oscilación de Ballenas (Manos Fuertes)
nvim = ta.ema(nvi, 15)
nvimax = ta.highest(nvim, 90)
nvimin = ta.lowest(nvim, 90)
ballenas = (nvi - nvim) * 100 / math.max(nvimax - nvimin, 1)
plot(minoristas, color=color.new(color.green, 40), style=plot.style_area, title="Volumen Minorista (Verde)")
plot(ballenas, color=color.new(color.blue, 20), style=plot.style_area, title="Volumen Ballenas (Azul)")
// =====================================================================
// 2. INDICADOR DE MOMENTUM (MACD)
// =====================================================================
[macdLine, signalLine, hist] = ta.macd(close, 12, 26, 9)
escala_momentum = 5 // Multiplicador para igualar la escala del Konkorde visualmente
color_hist = hist > hist[1] ? color.new(color.orange, 0) : color.new(color.red, 0)
plot(hist * escala_momentum, color=color_hist, style=plot.style_columns, title="Momentum (Columnas)")
hline(0, color=color.gray, linestyle=hline.style_dashed)
// =====================================================================
// 3. MEDIAS MÓVILES CONFIGURABLES (Proyectadas al gráfico superior)
// =====================================================================
len1 = input.int(9, title="Longitud EMA 1")
len2 = input.int(21, title="Longitud EMA 2")
len3 = input.int(50, title="Longitud EMA 3")
ema1 = ta.ema(close, len1)
ema2 = ta.ema(close, len2)
ema3 = ta.ema(close, len3)
// El uso de force_overlay=true envía estas líneas a las velas japonesas
plot(ema1, color=color.new(color.yellow, 0), linewidth=2, title="EMA Rápida", force_overlay=true)
plot(ema2, color=color.new(color.white, 0), linewidth=2, title="EMA Media", force_overlay=true)
plot(ema3, color=color.new(color.purple, 0), linewidth=2, title="EMA Lenta", force_overlay=true)
// =====================================================================
// 4. RETROCESO DE FIBONACCI (Proyectado al gráfico superior)
// =====================================================================
fibo_lookback = input.int(100, title="Periodo para Fibonacci")
hh = ta.highest(high, fibo_lookback)
ll = ta.lowest(low, fibo_lookback)
diff = hh - ll
plot(hh, color=color.new(color.red, 50), title="100% (Máximo)", force_overlay=true)
plot(hh - diff * 0.236, color=color.new(color.gray, 60), title="76.4%", force_overlay=true)
plot(hh - diff * 0.382, color=color.new(color.gray, 60), title="61.8%", force_overlay=true)
plot(hh - diff * 0.500, color=color.new(color.aqua, 20), linewidth=2, title="50.0% (Equilibrio)", force_overlay=true)
plot(hh - diff * 0.618, color=color.new(color.gray, 60), title="38.2%", force_overlay=true)
plot(ll, color=color.new(color.green, 50), title="0% (Mínimo)", force_overlay=true)
//version=6
indicator("Sistema Swing Completo (Konkorde + MAs + Fibo)", overlay=false)
// =====================================================================
// 1. KONCORDE (VOLUMEN DE BALLENAS VS MINORISTAS)
// =====================================================================
// Cálculo de PVI (Minoristas) y NVI (Ballenas)
var float pvi = 1000.0
var float nvi = 1000.0
if bar_index > 0
pvi := volume > volume[1] ? pvi[1] + ((close - close[1]) / close[1]) * pvi[1] : pvi[1]
nvi := volume < volume[1] ? nvi[1] + ((close - close[1]) / close[1]) * nvi[1] : nvi[1]
// Oscilación de Minoristas (Manos Débiles)
pvim = ta.ema(pvi, 15)
pvimax = ta.highest(pvim, 90)
pvimin = ta.lowest(pvim, 90)
minoristas = (pvi - pvim) * 100 / math.max(pvimax - pvimin, 1)
// Oscilación de Ballenas (Manos Fuertes)
nvim = ta.ema(nvi, 15)
nvimax = ta.highest(nvim, 90)
nvimin = ta.lowest(nvim, 90)
ballenas = (nvi - nvim) * 100 / math.max(nvimax - nvimin, 1)
plot(minoristas, color=color.new(color.green, 40), style=plot.style_area, title="Volumen Minorista (Verde)")
plot(ballenas, color=color.new(color.blue, 20), style=plot.style_area, title="Volumen Ballenas (Azul)")
// =====================================================================
// 2. INDICADOR DE MOMENTUM (MACD)
// =====================================================================
[macdLine, signalLine, hist] = ta.macd(close, 12, 26, 9)
escala_momentum = 5 // Multiplicador para igualar la escala del Konkorde visualmente
color_hist = hist > hist[1] ? color.new(color.orange, 0) : color.new(color.red, 0)
plot(hist * escala_momentum, color=color_hist, style=plot.style_columns, title="Momentum (Columnas)")
hline(0, color=color.gray, linestyle=hline.style_dashed)
// =====================================================================
// 3. MEDIAS MÓVILES CONFIGURABLES (Proyectadas al gráfico superior)
// =====================================================================
len1 = input.int(9, title="Longitud EMA 1")
len2 = input.int(21, title="Longitud EMA 2")
len3 = input.int(50, title="Longitud EMA 3")
ema1 = ta.ema(close, len1)
ema2 = ta.ema(close, len2)
ema3 = ta.ema(close, len3)
// El uso de force_overlay=true envía estas líneas a las velas japonesas
plot(ema1, color=color.new(color.yellow, 0), linewidth=2, title="EMA Rápida", force_overlay=true)
plot(ema2, color=color.new(color.white, 0), linewidth=2, title="EMA Media", force_overlay=true)
plot(ema3, color=color.new(color.purple, 0), linewidth=2, title="EMA Lenta", force_overlay=true)
// =====================================================================
// 4. RETROCESO DE FIBONACCI (Proyectado al gráfico superior)
// =====================================================================
fibo_lookback = input.int(100, title="Periodo para Fibonacci")
hh = ta.highest(high, fibo_lookback)
ll = ta.lowest(low, fibo_lookback)
diff = hh - ll
plot(hh, color=color.new(color.red, 50), title="100% (Máximo)", force_overlay=true)
plot(hh - diff * 0.236, color=color.new(color.gray, 60), title="76.4%", force_overlay=true)
plot(hh - diff * 0.382, color=color.new(color.gray, 60), title="61.8%", force_overlay=true)
plot(hh - diff * 0.500, color=color.new(color.aqua, 20), linewidth=2, title="50.0% (Equilibrio)", force_overlay=true)
plot(hh - diff * 0.618, color=color.new(color.gray, 60), title="38.2%", force_overlay=true)
plot(ll, color=color.new(color.green, 50), title="0% (Mínimo)", force_overlay=true)
Versionshinweise
LE SUME UNA TABLA DE INFLUENCIA QUE CUANDO 3/4 INDICADORES SE ALINEAN ES SEÑAL DE COMPRAVersionshinweise
AGREGUE LOS PUNTOS DE VENTAOpen-source Skript
Ganz im Sinne von TradingView hat dieser Autor sein/ihr Script als Open-Source veröffentlicht. Auf diese Weise können nun auch andere Trader das Script rezensieren und die Funktionalität überprüfen. Vielen Dank an den Autor! Sie können das Script kostenlos verwenden, aber eine Wiederveröffentlichung des Codes unterliegt unseren Hausregeln.

Haftungsausschluss
Die Informationen und Veröffentlichungen sind nicht als Finanz-, Anlage-, Handels- oder andere Arten von Ratschlägen oder Empfehlungen gedacht, die von TradingView bereitgestellt oder gebilligt werden, und stellen diese nicht dar. Lesen Sie mehr in den Nutzungsbedingungen.
Open-source Skript
Ganz im Sinne von TradingView hat dieser Autor sein/ihr Script als Open-Source veröffentlicht. Auf diese Weise können nun auch andere Trader das Script rezensieren und die Funktionalität überprüfen. Vielen Dank an den Autor! Sie können das Script kostenlos verwenden, aber eine Wiederveröffentlichung des Codes unterliegt unseren Hausregeln.
Haftungsausschluss
Die Informationen und Veröffentlichungen sind nicht als Finanz-, Anlage-, Handels- oder andere Arten von Ratschlägen oder Empfehlungen gedacht, die von TradingView bereitgestellt oder gebilligt werden, und stellen diese nicht dar. Lesen Sie mehr in den Nutzungsbedingungen.