PSP - NQ ES YM
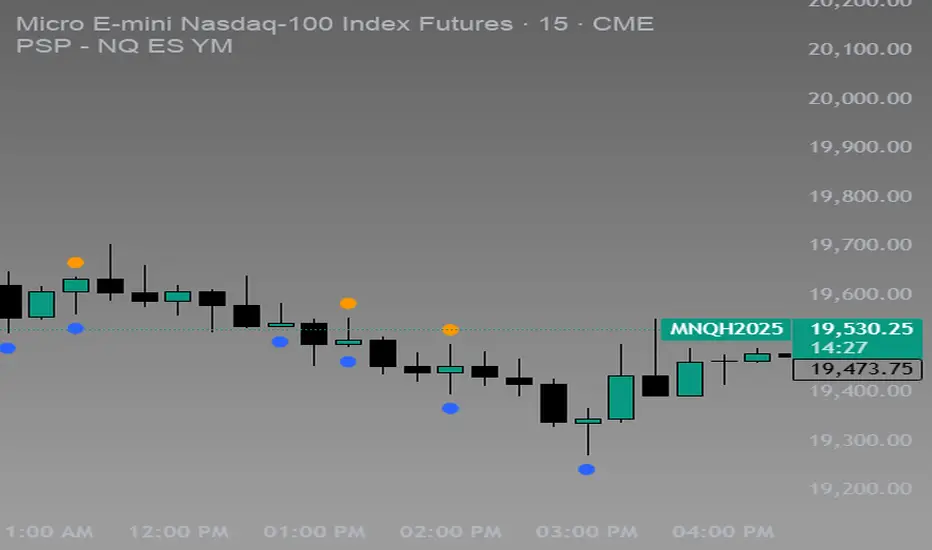
The PSP - NQ ES YM indicator tracks the price movements of the NQ, ES, and YM futures to identify correlation and divergence between them.
🔸 Orange dot (above candle) → When NQ and ES have opposite trends (one up, one down).
🔹 Blue dot (below candle) → When YM differs from either NQ or ES, but NQ and ES are aligned.
🟠🔹 Both dots on the same candle → When NQ and ES differ, and one of them also differs from YM.
🟢 Green dot (above candle at 12 AM NY time) → Marks the daily open at 12 AM New York time.
This helps traders spot market divergence patterns between major indices and potential trading opportunities. 🚀

Haftungsausschluss
Die Informationen und Veröffentlichungen sind nicht als Finanz-, Anlage-, Handels- oder andere Arten von Ratschlägen oder Empfehlungen gedacht, die von TradingView bereitgestellt oder gebilligt werden, und stellen diese nicht dar. Lesen Sie mehr in den Nutzungsbedingungen.
Haftungsausschluss
Die Informationen und Veröffentlichungen sind nicht als Finanz-, Anlage-, Handels- oder andere Arten von Ratschlägen oder Empfehlungen gedacht, die von TradingView bereitgestellt oder gebilligt werden, und stellen diese nicht dar. Lesen Sie mehr in den Nutzungsbedingungen.