OPEN-SOURCE SCRIPT
Aktualisiert Multi-Asset SuperTrend Map [BigBeluga]
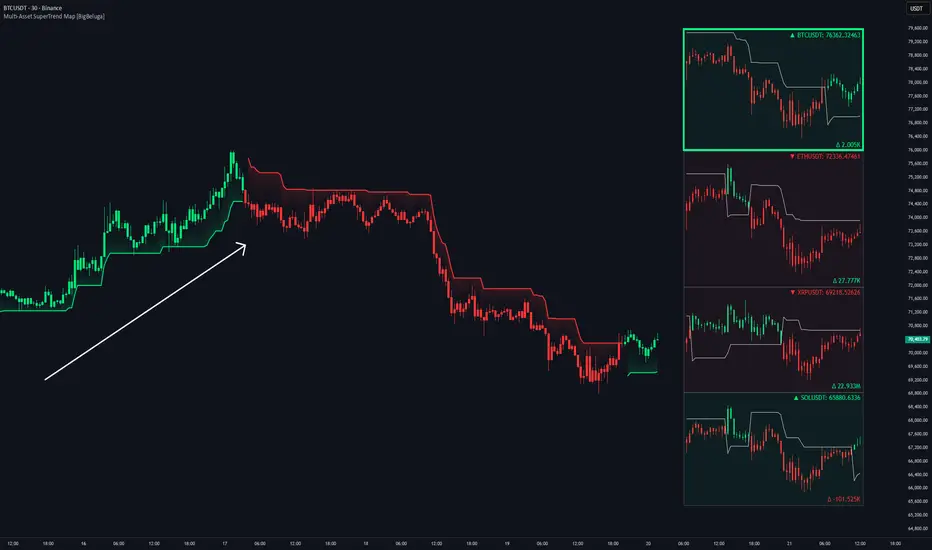
🔵 OVERVIEW
Multi-Asset SuperTrend Map [BigBeluga] is a comparative market-structure visualization tool that displays multiple assets side-by-side using a unified SuperTrend framework.
Instead of switching charts or stacking indicators, this tool compresses several markets into a single view, allowing traders to instantly assess trend direction, volatility alignment, and volume pressure across assets.

Each asset is reconstructed as a scaled synthetic candle stream, aligned to the current chart’s volatility, and overlaid with its own SuperTrend logic.
🔵 CORE CONCEPT
🔵 CALCULATION & LOGIC
1. SuperTrend Engine
2. Multi-Asset Scaling Logic
3. Synthetic Candle Reconstruction
4. SuperTrend Mapping
5. Delta Volume Aggregation
🔵 VISUAL STRUCTURE
⚠️MARKET SESSION BEHAVIOR
🔵 HOW TO USE
🔵 CONCLUSION
Multi-Asset SuperTrend Map [BigBeluga] transforms SuperTrend from a single-market indicator into a cross-market decision framework.
By normalizing volatility, synchronizing time, and adding volume delta context, it enables traders to evaluate trend quality, alignment, and participation across assets — all from one chart.
This makes it especially powerful for crypto pairs, index baskets, and correlated markets where relative behavior matters as much as absolute price direction.
Multi-Asset SuperTrend Map [BigBeluga] is a comparative market-structure visualization tool that displays multiple assets side-by-side using a unified SuperTrend framework.
Instead of switching charts or stacking indicators, this tool compresses several markets into a single view, allowing traders to instantly assess trend direction, volatility alignment, and volume pressure across assets.
Each asset is reconstructed as a scaled synthetic candle stream, aligned to the current chart’s volatility, and overlaid with its own SuperTrend logic.
🔵 CORE CONCEPT
- SuperTrend as Regime Filter — Each asset uses the same ATR-based SuperTrend logic to determine bullish or bearish state.
- Volatility Normalization — Assets are scaled using ATR ratios so high-price and low-price symbols can be compared visually on one chart.
- Synchronized Time Axis — All assets are plotted on the current chart timeframe, enabling true bar-to-bar comparison.
- Trend + Delta Context — In addition to trend direction, the indicator aggregates directional volume (delta) to reveal participation strength.
🔵 CALCULATION & LOGIC
1. SuperTrend Engine
- The indicator uses TradingView’s native SuperTrend calculation:
Pine Script® - ATR Length controls volatility smoothing.
- ATR Factor defines band width and trend sensitivity.
- Trend direction is binary:
- Bullish when price is above the SuperTrend line.
- Bearish when price is below the SuperTrend line.
2. Multi-Asset Scaling Logic
- Each external symbol is fetched using request.security().
- ATR is calculated both on the chart symbol and the external symbol.
- A scaling coefficient is derived:
- chart ATR ÷ symbol ATR
Pine Script® - All OHLC values are remapped so different assets share a comparable vertical range.
3. Synthetic Candle Reconstruction
- Each asset is redrawn using:
- Vertical lines for wicks
- Thick lines for candle bodies
- Candle color logic:
- Trend-based (SuperTrend direction) if enabled
- Otherwise standard bullish/bearish candle logic
- Trend-based (SuperTrend direction) if enabled
4. SuperTrend Mapping
- The SuperTrend line for each asset is remapped and drawn as a polyline.
- This allows trend curvature and regime shifts to be compared visually across symbols.
5. Delta Volume Aggregation
- Directional volume is accumulated:
- Volume added when close > open
- Volume subtracted when close < open
- Delta is displayed per asset, showing whether bullish or bearish participation dominates.
🔵 VISUAL STRUCTURE
- Each asset is wrapped inside a bounding box representing its full recent range.
- Background color reflects current trend direction (bullish or bearish).
- Asset label displays:
- Symbol name
- Current price
- Trend direction arrow (▲ / ▼)
- Delta volume is displayed beneath the asset block for flow context.
⚠️MARKET SESSION BEHAVIOR
- On lower timeframes (e.g. 1m–12h), traditional stock markets are closed during weekends.
- During these periods, price data may appear as flat or static candles with minimal or no movement.
- This is expected behavior and reflects the absence of active trading, not a calculation error.
- Crypto markets remain unaffected and continue updating normally.
🔵 HOW TO USE
- Compare trend alignment across correlated markets (e.g., BTC vs ETH).
- Identify relative strength when one asset trends while others stall.
- Use delta volume to confirm whether trends are supported by participation.
- Spot early divergence when price trends align but delta disagrees.
- Combine with higher-timeframe structure or liquidity tools for execution.
🔵 CONCLUSION
Multi-Asset SuperTrend Map [BigBeluga] transforms SuperTrend from a single-market indicator into a cross-market decision framework.
By normalizing volatility, synchronizing time, and adding volume delta context, it enables traders to evaluate trend quality, alignment, and participation across assets — all from one chart.
This makes it especially powerful for crypto pairs, index baskets, and correlated markets where relative behavior matters as much as absolute price direction.
Versionshinweise
- Price value fixOpen-source Skript
Ganz im Sinne von TradingView hat dieser Autor sein/ihr Script als Open-Source veröffentlicht. Auf diese Weise können nun auch andere Trader das Script rezensieren und die Funktionalität überprüfen. Vielen Dank an den Autor! Sie können das Script kostenlos verwenden, aber eine Wiederveröffentlichung des Codes unterliegt unseren Hausregeln.

🌐 bigbeluga.org/tv - Get access to our powerful tools & indicators.
🔵 Learn More -> docs.bigbeluga.org/
🔵 Join Discord -> go.bigbeluga.org/k65q9bfqfu
All content provided by BigBeluga is for educational purposes only
🔵 Learn More -> docs.bigbeluga.org/
🔵 Join Discord -> go.bigbeluga.org/k65q9bfqfu
All content provided by BigBeluga is for educational purposes only
Haftungsausschluss
Die Informationen und Veröffentlichungen sind nicht als Finanz-, Anlage-, Handels- oder andere Arten von Ratschlägen oder Empfehlungen gedacht, die von TradingView bereitgestellt oder gebilligt werden, und stellen diese nicht dar. Lesen Sie mehr in den Nutzungsbedingungen.
Open-source Skript
Ganz im Sinne von TradingView hat dieser Autor sein/ihr Script als Open-Source veröffentlicht. Auf diese Weise können nun auch andere Trader das Script rezensieren und die Funktionalität überprüfen. Vielen Dank an den Autor! Sie können das Script kostenlos verwenden, aber eine Wiederveröffentlichung des Codes unterliegt unseren Hausregeln.
🌐 bigbeluga.org/tv - Get access to our powerful tools & indicators.
🔵 Learn More -> docs.bigbeluga.org/
🔵 Join Discord -> go.bigbeluga.org/k65q9bfqfu
All content provided by BigBeluga is for educational purposes only
🔵 Learn More -> docs.bigbeluga.org/
🔵 Join Discord -> go.bigbeluga.org/k65q9bfqfu
All content provided by BigBeluga is for educational purposes only
Haftungsausschluss
Die Informationen und Veröffentlichungen sind nicht als Finanz-, Anlage-, Handels- oder andere Arten von Ratschlägen oder Empfehlungen gedacht, die von TradingView bereitgestellt oder gebilligt werden, und stellen diese nicht dar. Lesen Sie mehr in den Nutzungsbedingungen.