Linear Correlation Coefficient W/ MAs and Significance Tests
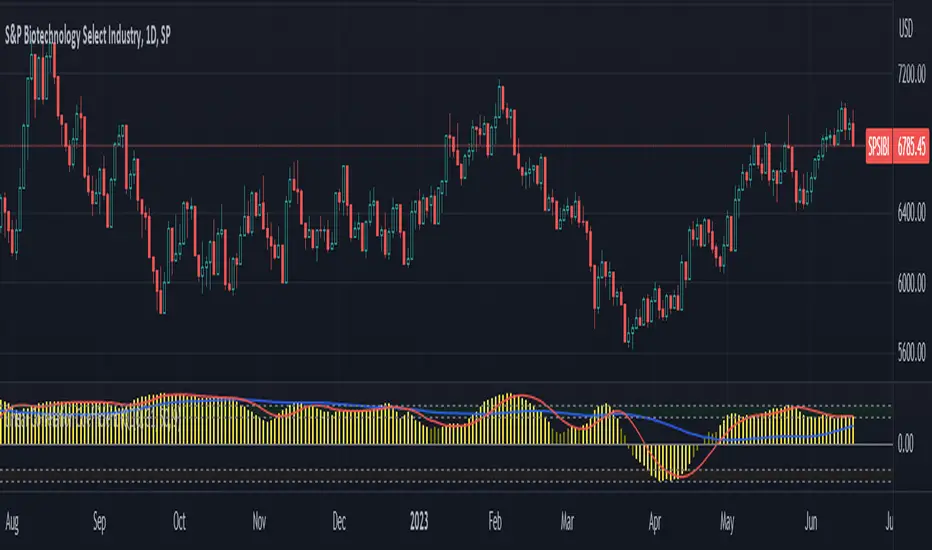
This Linear CC takes into account the log-normal distribution of stock prices and performs Pearson correlation on that data set. It also smoothens the results into an easy to read oscillator, and performs a two-tail t-test on the correlation coefficient data (with a = 0.05) to determine the significance of the coefficients. Significant results are shown in a solid yellow color while insignificant results are shown in a dark yellow color (you can eyeball this with a normal LCC by looking at results around -0.5 to +0.5).
Two MAs are provided as well for a quick trend analysis. You can reduce the lookback period, but it defaults to 31 for the sake of statistical standards.
Two MAs are provided as well for a quick trend analysis. You can reduce the lookback period, but it defaults to 31 for the sake of statistical standards.

Haftungsausschluss
Die Informationen und Veröffentlichungen sind nicht als Finanz-, Anlage-, Handels- oder andere Arten von Ratschlägen oder Empfehlungen gedacht, die von TradingView bereitgestellt oder gebilligt werden, und stellen diese nicht dar. Lesen Sie mehr in den Nutzungsbedingungen.
Haftungsausschluss
Die Informationen und Veröffentlichungen sind nicht als Finanz-, Anlage-, Handels- oder andere Arten von Ratschlägen oder Empfehlungen gedacht, die von TradingView bereitgestellt oder gebilligt werden, und stellen diese nicht dar. Lesen Sie mehr in den Nutzungsbedingungen.