RSI Moving Average Crossovers by KD
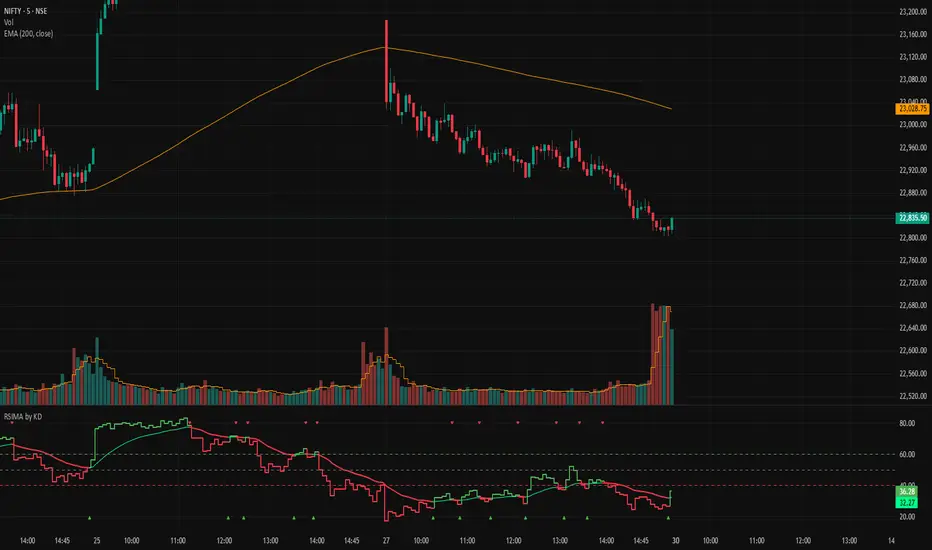
**Indicator Description:**
RSI Moving Average Crossovers (RSIMAC) is a powerful momentum indicator that plots the Relative Strength Index (RSI) along with its moving average.
The RSI line dynamically changes color based on whether it is trading **above** or **below** its MA. The RSI MA line also changes color accordingly, making trend shifts and momentum strength visually clear at a glance. The area between the RSI and its MA is filled with corresponding bullish or bearish colors.
Key features include:
- Customizable RSI and RSI MA colors
- Dynamic fill between RSI and its moving average
- Visual crossover signals for both RSI/MA and Fast/Slow price MAs
- Trend-based background coloring and a compact screener table
Ideal for identifying momentum shifts, overbought/oversold conditions, and potential reversals.
---
"RSI with dynamic coloring based on its moving average. RSI and RSI MA lines change color when RSI crosses above or below the MA. Includes fill, crossover signals, price MA trend detection, and a live screener table."
---
RSI Moving Average Crossovers (RSIMAC) is a powerful momentum indicator that plots the Relative Strength Index (RSI) along with its moving average.
The RSI line dynamically changes color based on whether it is trading **above** or **below** its MA. The RSI MA line also changes color accordingly, making trend shifts and momentum strength visually clear at a glance. The area between the RSI and its MA is filled with corresponding bullish or bearish colors.
Key features include:
- Customizable RSI and RSI MA colors
- Dynamic fill between RSI and its moving average
- Visual crossover signals for both RSI/MA and Fast/Slow price MAs
- Trend-based background coloring and a compact screener table
Ideal for identifying momentum shifts, overbought/oversold conditions, and potential reversals.
---
"RSI with dynamic coloring based on its moving average. RSI and RSI MA lines change color when RSI crosses above or below the MA. Includes fill, crossover signals, price MA trend detection, and a live screener table."
---

Haftungsausschluss
Die Informationen und Veröffentlichungen sind nicht als Finanz-, Anlage-, Handels- oder andere Arten von Ratschlägen oder Empfehlungen gedacht, die von TradingView bereitgestellt oder gebilligt werden, und stellen diese nicht dar. Lesen Sie mehr in den Nutzungsbedingungen.
Haftungsausschluss
Die Informationen und Veröffentlichungen sind nicht als Finanz-, Anlage-, Handels- oder andere Arten von Ratschlägen oder Empfehlungen gedacht, die von TradingView bereitgestellt oder gebilligt werden, und stellen diese nicht dar. Lesen Sie mehr in den Nutzungsbedingungen.