OPEN-SOURCE SCRIPT
Average Price History Candle
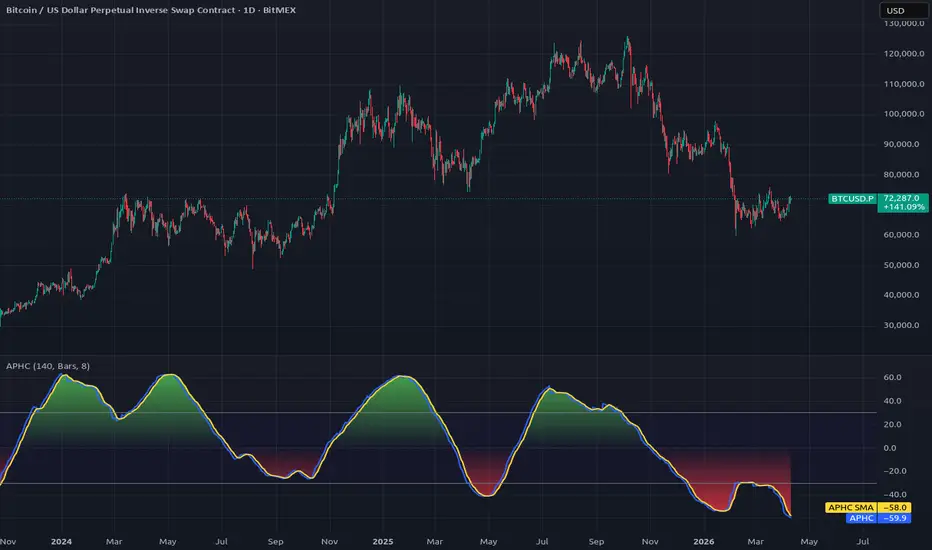
The Average Price History Candle indicator (APHC) is my own invention and is entirely new.
It's calculated from a time period, specified by a number of bars, hours or days.
It's basically one candle calculated from the average price history, with the high and low being that of the specified time period.
The open is the average (SMA) of the first half of the time period.
The close is the average (SMA) of the second half of the time period.
The plot is the size of the candle body expressed as a percentage of the whole price range, with positive being bullish and negative bearish.
It generally resembles a sine wave more or less, as the momentume shifts from bullish to bearish and back again.
Because it's fairly consistant and predictable, it gives a good indication where the market momentum is going next.
It also seems to work quite well with divergences.
Using a time period of a very few bars, say 6 or 8, it behaves more like an RSI or Stochastic.
But to be honest, I've not had much chance to explore all the different ways in which this indicator could be used to provide useful trading information.
Please leave ideas in the comments if you find ways in which you find it useful. Thanks.
It's calculated from a time period, specified by a number of bars, hours or days.
It's basically one candle calculated from the average price history, with the high and low being that of the specified time period.
The open is the average (SMA) of the first half of the time period.
The close is the average (SMA) of the second half of the time period.
The plot is the size of the candle body expressed as a percentage of the whole price range, with positive being bullish and negative bearish.
It generally resembles a sine wave more or less, as the momentume shifts from bullish to bearish and back again.
Because it's fairly consistant and predictable, it gives a good indication where the market momentum is going next.
It also seems to work quite well with divergences.
Using a time period of a very few bars, say 6 or 8, it behaves more like an RSI or Stochastic.
But to be honest, I've not had much chance to explore all the different ways in which this indicator could be used to provide useful trading information.
Please leave ideas in the comments if you find ways in which you find it useful. Thanks.
Open-source Skript
Ganz im Sinne von TradingView hat dieser Autor sein/ihr Script als Open-Source veröffentlicht. Auf diese Weise können nun auch andere Trader das Script rezensieren und die Funktionalität überprüfen. Vielen Dank an den Autor! Sie können das Script kostenlos verwenden, aber eine Wiederveröffentlichung des Codes unterliegt unseren Hausregeln.

Haftungsausschluss
Die Informationen und Veröffentlichungen sind nicht als Finanz-, Anlage-, Handels- oder andere Arten von Ratschlägen oder Empfehlungen gedacht, die von TradingView bereitgestellt oder gebilligt werden, und stellen diese nicht dar. Lesen Sie mehr in den Nutzungsbedingungen.
Open-source Skript
Ganz im Sinne von TradingView hat dieser Autor sein/ihr Script als Open-Source veröffentlicht. Auf diese Weise können nun auch andere Trader das Script rezensieren und die Funktionalität überprüfen. Vielen Dank an den Autor! Sie können das Script kostenlos verwenden, aber eine Wiederveröffentlichung des Codes unterliegt unseren Hausregeln.
Haftungsausschluss
Die Informationen und Veröffentlichungen sind nicht als Finanz-, Anlage-, Handels- oder andere Arten von Ratschlägen oder Empfehlungen gedacht, die von TradingView bereitgestellt oder gebilligt werden, und stellen diese nicht dar. Lesen Sie mehr in den Nutzungsbedingungen.