OPEN-SOURCE SCRIPT
Institutional Bias & Liquidity Dashboard [FlowDesk Atlas]
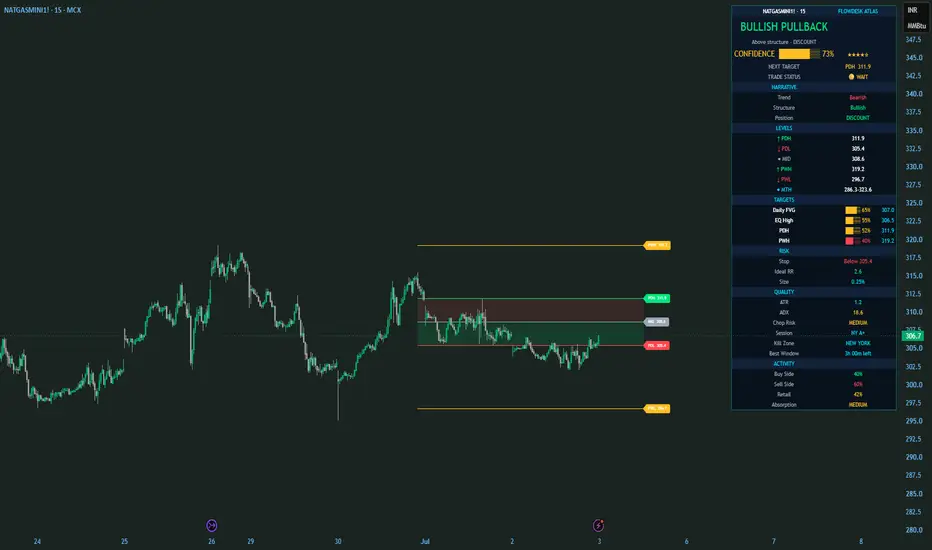
Institutional Bias & Liquidity Dashboard [FlowDesk Atlas]
A single-panel market intelligence dashboard that reads trend, structure, liquidity, and risk together and distills them into one clear read: current bias, the highest-probability liquidity target, and whether conditions currently support a trade.
How it works
The dashboard combines several independent signals into one composite view:
Key features
How to use it
Settings
Notes & disclaimer
Probability, confidence, and institutional-activity figures are statistical/heuristic estimates derived from price and volume history — they are not order-flow data and are not guarantees of future price behavior. This tool is provided for educational and informational purposes only and does not constitute financial advice. Always combine it with your own analysis and risk management.
A single-panel market intelligence dashboard that reads trend, structure, liquidity, and risk together and distills them into one clear read: current bias, the highest-probability liquidity target, and whether conditions currently support a trade.
How it works
The dashboard combines several independent signals into one composite view:
- Trend & Structure — EMA50 slope plus a DI+/DI- (ADX) structure filter on the chart timeframe, cross-checked against a higher timeframe (configurable) for alignment.
- Confidence Score — a weighted 0-100 score built from trend alignment, structure clarity, HTF alignment, ADX strength, and premium/discount location.
- Liquidity Targets — Previous Day/Week/Month High-Low, an equal-highs/lows liquidity pool detector, a simplified daily Fair Value Gap, and the prior NY session high — each ranked and displayed by historical sweep/reach probability, highest first.
- Session Intelligence — Asia/London/NY session tracking with a live countdown timer, plus an automatically-ranked "Kill Zone" based on each session's historical average range.
- Risk Engine — an ATR-based stop suggestion, a configurable ideal risk-reward, and a position-size hint that scales with the confidence score.
- Market Quality & Institutional Activity — ADX-based chop risk, and volume-direction heuristics for buy/sell pressure, retail-noise activity, and liquidity absorption.
Key features
- One-glance hero panel: bias, confidence, next target, and trade status (READY / WAIT / STAND DOWN)
- Liquidity targets automatically ranked by probability, not just listed
- Directional key-level labels (↑ resistance, ↓ support, ● neutral) that update with price
- Live session kill-zone and best-trading-window countdown
- Fully adjustable dashboard position, text size, and transparency
- Built-in alerts for high-confidence environments, tradeable conditions, and stand-down conditions
How to use it
- Add the indicator to any symbol and timeframe.
- Read the hero panel first — narrative, confidence %, and trade status.
- Check the ranked Targets table for where liquidity is most likely headed next.
- Use the Risk card for a starting stop/RR reference before sizing a trade.
- Use Session Intelligence to time entries around the historically highest-quality session.
Settings
- HTF Narrative Timeframe, Probability Lookback
- Dashboard position, text size, transparency
- ATR length, stop multiplier, ideal RR
- Session timezone and custom session windows (Asia/London/NY)
Notes & disclaimer
Probability, confidence, and institutional-activity figures are statistical/heuristic estimates derived from price and volume history — they are not order-flow data and are not guarantees of future price behavior. This tool is provided for educational and informational purposes only and does not constitute financial advice. Always combine it with your own analysis and risk management.
Open-source Skript
Ganz im Sinne von TradingView hat dieser Autor sein/ihr Script als Open-Source veröffentlicht. Auf diese Weise können nun auch andere Trader das Script rezensieren und die Funktionalität überprüfen. Vielen Dank an den Autor! Sie können das Script kostenlos verwenden, aber eine Wiederveröffentlichung des Codes unterliegt unseren Hausregeln.

Haftungsausschluss
Die Informationen und Veröffentlichungen sind nicht als Finanz-, Anlage-, Handels- oder andere Arten von Ratschlägen oder Empfehlungen gedacht, die von TradingView bereitgestellt oder gebilligt werden, und stellen diese nicht dar. Lesen Sie mehr in den Nutzungsbedingungen.
Open-source Skript
Ganz im Sinne von TradingView hat dieser Autor sein/ihr Script als Open-Source veröffentlicht. Auf diese Weise können nun auch andere Trader das Script rezensieren und die Funktionalität überprüfen. Vielen Dank an den Autor! Sie können das Script kostenlos verwenden, aber eine Wiederveröffentlichung des Codes unterliegt unseren Hausregeln.
Haftungsausschluss
Die Informationen und Veröffentlichungen sind nicht als Finanz-, Anlage-, Handels- oder andere Arten von Ratschlägen oder Empfehlungen gedacht, die von TradingView bereitgestellt oder gebilligt werden, und stellen diese nicht dar. Lesen Sie mehr in den Nutzungsbedingungen.