OPEN-SOURCE SCRIPT
Psycho Flip - Stiletto Ops - Ladies Edition
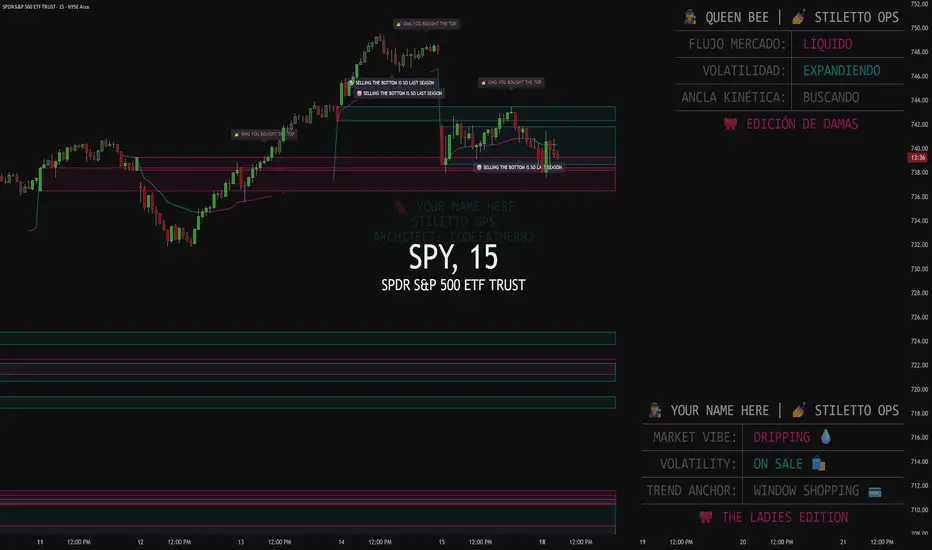
TITLE: Psycho Flip - Stiletto Ops
DESCRIPTION:
The Psycho Flip - Stiletto Ops is a technical utility script that combines volatility tracking, volume-weighted analysis, and price action filters into a single indicator. Its primary purpose is to help traders visually differentiate between low-liquidity consolidation and volume-backed momentum, while identifying structural exhaustion points.
To comply with script publishing guidelines, here is the explicit breakdown of the underlying calculations and methodology:
1. Volatility & Compression Filtering (Grey-Out Feature)
Methodology: The script calculates a standard 14-period Average True Range (ATR) and smooths it using a 50-period Simple Moving Average (SMA). Simultaneously, it tracks standard volume against a 50-period Volume SMA.
Execution: When the current bar's volume is below the 50-Volume SMA, AND the current 14-ATR is below the 50-ATR SMA, the script alters the bar color to grey. This visually indicates a statistically low-volatility and low-liquidity market environment.
2. Momentum Identification (Bounding Boxes)
Methodology: The script scans for significant momentum expansion using a dual-condition threshold.
Execution: A bounding box is plotted over the candles only when current volume exceeds the 50-period Volume SMA by a factor of 2.0x or higher, AND the current candle's directional body (open to close) accounts for at least 60% of its total high-low range. This isolates bars with both high participation and directional conviction.
3. Dynamic Anchored VWAP
Methodology: Rather than anchoring to a fixed time or session, the script utilizes a dynamic accumulator for volume and price.
Execution: When the Momentum Identification conditions (Step 2) are met, the script automatically resets its anchor. It plots a live Volume Weighted Average Price (VWAP) originating from that specific high-volume expansion bar, tracking the average cost-basis of the resulting price movement.
4. Exhaustion Detection (Text Labels)
Methodology: The script utilizes a 5-bar lookback period (ta.highest and ta.lowest) to identify local structural extremes.
Execution: If price forms a new local high or low, the script evaluates the candle's profile. If the candle is a Doji (where the body is less than 35% of the total range) AND the volume is below the 50-period Volume SMA, the script prints a text label above/below the bar. This highlights a structural extreme forming on below-average market participation. Note: The UI contains a thematic setting ("Queen Bee") that alters the text of these standard alerts for behavioral finance tracking.
HOW TO USE:
Trend Context: Utilize the Auto-Anchored VWAP line as dynamic support/resistance.
Filter Consolidation: Use the grey-colored bars to identify periods where volatility is statistically compressed.
Exhaustion Flags: Use the text labels at local highs/lows to identify potential reversal points forming on low volume.
DESCRIPTION:
The Psycho Flip - Stiletto Ops is a technical utility script that combines volatility tracking, volume-weighted analysis, and price action filters into a single indicator. Its primary purpose is to help traders visually differentiate between low-liquidity consolidation and volume-backed momentum, while identifying structural exhaustion points.
To comply with script publishing guidelines, here is the explicit breakdown of the underlying calculations and methodology:
1. Volatility & Compression Filtering (Grey-Out Feature)
Methodology: The script calculates a standard 14-period Average True Range (ATR) and smooths it using a 50-period Simple Moving Average (SMA). Simultaneously, it tracks standard volume against a 50-period Volume SMA.
Execution: When the current bar's volume is below the 50-Volume SMA, AND the current 14-ATR is below the 50-ATR SMA, the script alters the bar color to grey. This visually indicates a statistically low-volatility and low-liquidity market environment.
2. Momentum Identification (Bounding Boxes)
Methodology: The script scans for significant momentum expansion using a dual-condition threshold.
Execution: A bounding box is plotted over the candles only when current volume exceeds the 50-period Volume SMA by a factor of 2.0x or higher, AND the current candle's directional body (open to close) accounts for at least 60% of its total high-low range. This isolates bars with both high participation and directional conviction.
3. Dynamic Anchored VWAP
Methodology: Rather than anchoring to a fixed time or session, the script utilizes a dynamic accumulator for volume and price.
Execution: When the Momentum Identification conditions (Step 2) are met, the script automatically resets its anchor. It plots a live Volume Weighted Average Price (VWAP) originating from that specific high-volume expansion bar, tracking the average cost-basis of the resulting price movement.
4. Exhaustion Detection (Text Labels)
Methodology: The script utilizes a 5-bar lookback period (ta.highest and ta.lowest) to identify local structural extremes.
Execution: If price forms a new local high or low, the script evaluates the candle's profile. If the candle is a Doji (where the body is less than 35% of the total range) AND the volume is below the 50-period Volume SMA, the script prints a text label above/below the bar. This highlights a structural extreme forming on below-average market participation. Note: The UI contains a thematic setting ("Queen Bee") that alters the text of these standard alerts for behavioral finance tracking.
HOW TO USE:
Trend Context: Utilize the Auto-Anchored VWAP line as dynamic support/resistance.
Filter Consolidation: Use the grey-colored bars to identify periods where volatility is statistically compressed.
Exhaustion Flags: Use the text labels at local highs/lows to identify potential reversal points forming on low volume.
Open-source Skript
Ganz im Sinne von TradingView hat dieser Autor sein/ihr Script als Open-Source veröffentlicht. Auf diese Weise können nun auch andere Trader das Script rezensieren und die Funktionalität überprüfen. Vielen Dank an den Autor! Sie können das Script kostenlos verwenden, aber eine Wiederveröffentlichung des Codes unterliegt unseren Hausregeln.

STEALTH UMBRELLA PROJECTIONS - 🚁 CODE3RECON : TACTICAL ALGO SYSTEMS
Unlock the INTEL HERE - stealth-umbrella.com
Ulysses Ken Eldridge (CodeFather82) | Lead Quant Architect
© Stealth Umbrella Projections, LLC
Unlock the INTEL HERE - stealth-umbrella.com
Ulysses Ken Eldridge (CodeFather82) | Lead Quant Architect
© Stealth Umbrella Projections, LLC
Haftungsausschluss
Die Informationen und Veröffentlichungen sind nicht als Finanz-, Anlage-, Handels- oder andere Arten von Ratschlägen oder Empfehlungen gedacht, die von TradingView bereitgestellt oder gebilligt werden, und stellen diese nicht dar. Lesen Sie mehr in den Nutzungsbedingungen.
Open-source Skript
Ganz im Sinne von TradingView hat dieser Autor sein/ihr Script als Open-Source veröffentlicht. Auf diese Weise können nun auch andere Trader das Script rezensieren und die Funktionalität überprüfen. Vielen Dank an den Autor! Sie können das Script kostenlos verwenden, aber eine Wiederveröffentlichung des Codes unterliegt unseren Hausregeln.
STEALTH UMBRELLA PROJECTIONS - 🚁 CODE3RECON : TACTICAL ALGO SYSTEMS
Unlock the INTEL HERE - stealth-umbrella.com
Ulysses Ken Eldridge (CodeFather82) | Lead Quant Architect
© Stealth Umbrella Projections, LLC
Unlock the INTEL HERE - stealth-umbrella.com
Ulysses Ken Eldridge (CodeFather82) | Lead Quant Architect
© Stealth Umbrella Projections, LLC
Haftungsausschluss
Die Informationen und Veröffentlichungen sind nicht als Finanz-, Anlage-, Handels- oder andere Arten von Ratschlägen oder Empfehlungen gedacht, die von TradingView bereitgestellt oder gebilligt werden, und stellen diese nicht dar. Lesen Sie mehr in den Nutzungsbedingungen.