OPEN-SOURCE SCRIPT
HTF Candle Boxes with Signals
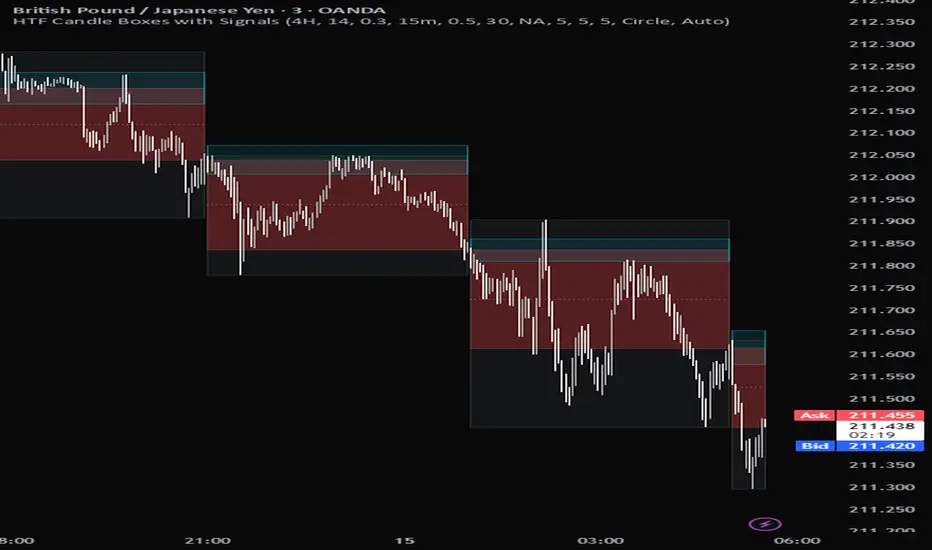
HTF Candle Boxes with Signals — See the 4H candle structure and catch the breakout the moment it happens.
© syouske. All rights reserved.
This indicator is an extended version of "HTF Candle Boxes" (also by syouske), combining the original candle box visualization with a built-in breakout signal detector. The HTF candle box rendering code is shared from the base indicator — if you only need the boxes without signals, use the standalone "HTF Candle Boxes" instead.
The Idea — Candlestick Anatomy
Every candlestick tells a story through its anatomy:
- The open marks where the crowd committed at the start of the period.
- The wicks reveal where price was rejected — liquidity was swept and the move failed.
- The body shows where price actually accepted and closed.
- The close is the final vote of the period.
When a 4H candle opens and immediately wicks away from its open (sweeping liquidity), then returns back to the opening area, the market is showing a failed move. That open price becomes a magnet. If price then breaks out of that opening zone with conviction, it signals that the sweep was a trap and the real move is beginning.
This indicator makes that entire sequence visible and alerts you the moment the breakout confirms.
How It Works
1. The 4H candle opens and wicks away from its open — this is the sweep.
2. Price returns to the opening zone (open ± ATR-based buffer).
3. Price breaks out of the zone on a confirmed bar.
- Bull setup: wick swept DOWN first, returned to open, broke UP
- Bear setup: wick swept UP first, returned to open, broke DOWN
HTF Candle Boxes
Each higher timeframe candle is rendered as three live zones that expand in real time:
- Upper wick zone (gray) — where price was rejected from the top
- Body zone (green/red) — the accepted range between open and close
- Lower wick zone (gray) — where price was rejected from the bottom
- Optional outer box wraps the full candle range
The boxes grow bar by bar as the HTF candle develops, so you always see the current structure clearly on any lower timeframe chart.
Opening Zone
A cyan box drawn around the 4H open price, sized using ATR from a selectable timeframe. This is the area price must return to before a breakout signal can fire. Fully adjustable via the "Zone ATR multiplier" and "Zone ATR timeframe" inputs.
Signal Rules
A signal fires only when all of the following are true:
- Phase 1: price swept away from the 4H open by at least "Min Wick Size" ATRs
- Phase 2: price returned into the opening zone
- Breakout: the previous bar closed inside the zone, current bar closes outside it
- Buffer: signal is suppressed during the first N minutes after the 4H candle opens
- Cooldown: minimum time between signals (default 5 minutes)
- Entry Filter (optional): Volume spike or Last Candles trend confirmation
Entry Filter Options
- NA — no additional filter, signal fires on zone breakout alone
- Volume — requires the EMA5/EMA10 volume oscillator to exceed a set threshold
- Last Candles — all N bars before the zone touch must be trending in the signal direction (bearish approach for bull signal, bullish approach for bear signal)
Customization
- HTF timeframe: 1H, 4H, or 1D
- Zone ATR length, multiplier, and timeframe (5m, 15m, 30m, 1H)
- Zone and box colors
- Signal shape: Circle, Triangle, Diamond, Square, Cross, Arrow
- Signal size: Auto, Tiny, Small, Normal, Large, Huge
- Buffer window duration after 4H open
- Signal cooldown period
Recommended Use
- Chart timeframe: 1M, 3M, 5M, or 15M
- Works on any liquid market: forex, crypto, indices, futures
- Best used alongside higher timeframe bias and key S/R levels
- Pair with the standalone "HTF Candle Boxes" indicator for multi-HTF analysis
Alerts
- "4H Shift — Bull" — bull breakout confirmed
- "4H Shift — Bear" — bear breakout confirmed
Set alerts to "Once per bar close" for best accuracy.
Disclaimer
This indicator is a tool for analysis, not financial advice. Past signals do not guarantee future results. Always use proper risk management.
© syouske. All rights reserved.
This indicator is an extended version of "HTF Candle Boxes" (also by syouske), combining the original candle box visualization with a built-in breakout signal detector. The HTF candle box rendering code is shared from the base indicator — if you only need the boxes without signals, use the standalone "HTF Candle Boxes" instead.
The Idea — Candlestick Anatomy
Every candlestick tells a story through its anatomy:
- The open marks where the crowd committed at the start of the period.
- The wicks reveal where price was rejected — liquidity was swept and the move failed.
- The body shows where price actually accepted and closed.
- The close is the final vote of the period.
When a 4H candle opens and immediately wicks away from its open (sweeping liquidity), then returns back to the opening area, the market is showing a failed move. That open price becomes a magnet. If price then breaks out of that opening zone with conviction, it signals that the sweep was a trap and the real move is beginning.
This indicator makes that entire sequence visible and alerts you the moment the breakout confirms.
How It Works
1. The 4H candle opens and wicks away from its open — this is the sweep.
2. Price returns to the opening zone (open ± ATR-based buffer).
3. Price breaks out of the zone on a confirmed bar.
- Bull setup: wick swept DOWN first, returned to open, broke UP
- Bear setup: wick swept UP first, returned to open, broke DOWN
HTF Candle Boxes
Each higher timeframe candle is rendered as three live zones that expand in real time:
- Upper wick zone (gray) — where price was rejected from the top
- Body zone (green/red) — the accepted range between open and close
- Lower wick zone (gray) — where price was rejected from the bottom
- Optional outer box wraps the full candle range
The boxes grow bar by bar as the HTF candle develops, so you always see the current structure clearly on any lower timeframe chart.
Opening Zone
A cyan box drawn around the 4H open price, sized using ATR from a selectable timeframe. This is the area price must return to before a breakout signal can fire. Fully adjustable via the "Zone ATR multiplier" and "Zone ATR timeframe" inputs.
Signal Rules
A signal fires only when all of the following are true:
- Phase 1: price swept away from the 4H open by at least "Min Wick Size" ATRs
- Phase 2: price returned into the opening zone
- Breakout: the previous bar closed inside the zone, current bar closes outside it
- Buffer: signal is suppressed during the first N minutes after the 4H candle opens
- Cooldown: minimum time between signals (default 5 minutes)
- Entry Filter (optional): Volume spike or Last Candles trend confirmation
Entry Filter Options
- NA — no additional filter, signal fires on zone breakout alone
- Volume — requires the EMA5/EMA10 volume oscillator to exceed a set threshold
- Last Candles — all N bars before the zone touch must be trending in the signal direction (bearish approach for bull signal, bullish approach for bear signal)
Customization
- HTF timeframe: 1H, 4H, or 1D
- Zone ATR length, multiplier, and timeframe (5m, 15m, 30m, 1H)
- Zone and box colors
- Signal shape: Circle, Triangle, Diamond, Square, Cross, Arrow
- Signal size: Auto, Tiny, Small, Normal, Large, Huge
- Buffer window duration after 4H open
- Signal cooldown period
Recommended Use
- Chart timeframe: 1M, 3M, 5M, or 15M
- Works on any liquid market: forex, crypto, indices, futures
- Best used alongside higher timeframe bias and key S/R levels
- Pair with the standalone "HTF Candle Boxes" indicator for multi-HTF analysis
Alerts
- "4H Shift — Bull" — bull breakout confirmed
- "4H Shift — Bear" — bear breakout confirmed
Set alerts to "Once per bar close" for best accuracy.
Disclaimer
This indicator is a tool for analysis, not financial advice. Past signals do not guarantee future results. Always use proper risk management.
Open-source Skript
Ganz im Sinne von TradingView hat dieser Autor sein/ihr Script als Open-Source veröffentlicht. Auf diese Weise können nun auch andere Trader das Script rezensieren und die Funktionalität überprüfen. Vielen Dank an den Autor! Sie können das Script kostenlos verwenden, aber eine Wiederveröffentlichung des Codes unterliegt unseren Hausregeln.

Haftungsausschluss
Die Informationen und Veröffentlichungen sind nicht als Finanz-, Anlage-, Handels- oder andere Arten von Ratschlägen oder Empfehlungen gedacht, die von TradingView bereitgestellt oder gebilligt werden, und stellen diese nicht dar. Lesen Sie mehr in den Nutzungsbedingungen.
Open-source Skript
Ganz im Sinne von TradingView hat dieser Autor sein/ihr Script als Open-Source veröffentlicht. Auf diese Weise können nun auch andere Trader das Script rezensieren und die Funktionalität überprüfen. Vielen Dank an den Autor! Sie können das Script kostenlos verwenden, aber eine Wiederveröffentlichung des Codes unterliegt unseren Hausregeln.
Haftungsausschluss
Die Informationen und Veröffentlichungen sind nicht als Finanz-, Anlage-, Handels- oder andere Arten von Ratschlägen oder Empfehlungen gedacht, die von TradingView bereitgestellt oder gebilligt werden, und stellen diese nicht dar. Lesen Sie mehr in den Nutzungsbedingungen.