Dino Candle-Range BO
# Dino Candle-Range BO
**Automatic Candle Range Detection with Close-Based Breakout Logic**
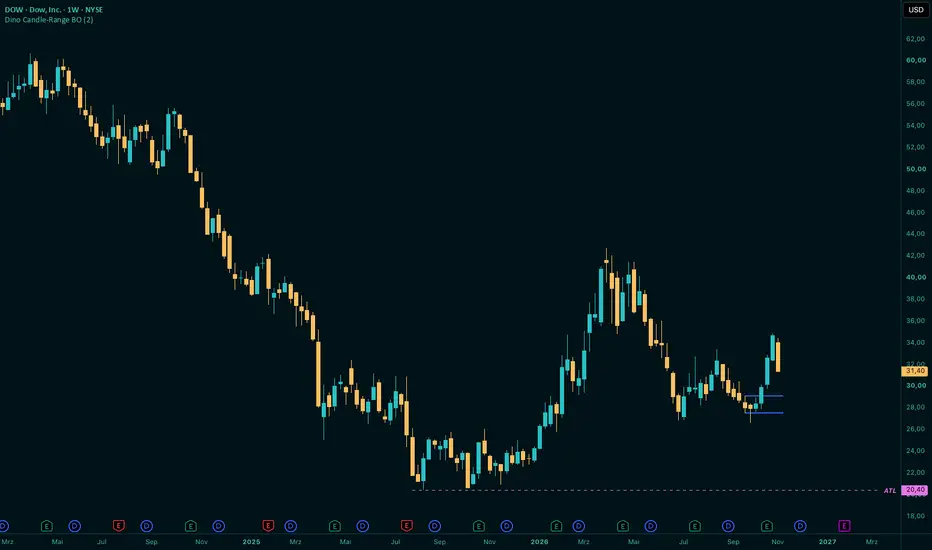
Dino Candle-Range BO is a lightweight price action indicator designed to identify and visualize relevant candle ranges directly on your chart.
The indicator automatically determines a reference candle, plots its high and low as horizontal levels, and maintains those levels until a new valid range structure is established following a confirmed breakout.
**The concept is simple: Two levels. Clear structure. No unnecessary signals.**
### How It Works
**1. Candle Range Detection**
When a candle closes strictly within the high-low range of the preceding candle, that preceding candle becomes the reference candle.
**2. Range High & Low**
The high and low of the reference candle are plotted as horizontal lines and extended to the right.
**3. Close-Based Breakout**
A breakout is confirmed only when a candle closes above the range high or below the range low. Wick-only breakouts are ignored.
**4. Range Reset**
After a confirmed breakout, the existing levels remain visible.
A new reference candle is established only when a subsequent candle closes within the high-low range of its immediate predecessor.
The previous range is then automatically replaced.
### Key Features
- Automatic candle range detection
- Close-based breakout confirmation
- Dynamic high and low levels
- No wick-only breakout signals
- Levels remain active until a new valid range is established
- Customizable line colors and thickness
- Works directly on the selected chart timeframe
- No additional indicators or external data required
### Trading Applications
Dino Candle-Range BO provides a clean visual framework for analyzing price action, consolidation areas, and structural breakouts.
The identified levels can be used as additional context for:
- Breakout and reclaim setups
- Support and resistance analysis
- Market structure assessment
- Price action confirmation
The indicator is intended as a chart analysis tool and does not generate standalone buy or sell signals.
**Disclaimer:** This indicator is provided for educational and analytical purposes only and does not constitute financial advice.
---
*Developed by DinoTrading | Dino's Trading School*
**Automatic Candle Range Detection with Close-Based Breakout Logic**
Dino Candle-Range BO is a lightweight price action indicator designed to identify and visualize relevant candle ranges directly on your chart.
The indicator automatically determines a reference candle, plots its high and low as horizontal levels, and maintains those levels until a new valid range structure is established following a confirmed breakout.
**The concept is simple: Two levels. Clear structure. No unnecessary signals.**
### How It Works
**1. Candle Range Detection**
When a candle closes strictly within the high-low range of the preceding candle, that preceding candle becomes the reference candle.
**2. Range High & Low**
The high and low of the reference candle are plotted as horizontal lines and extended to the right.
**3. Close-Based Breakout**
A breakout is confirmed only when a candle closes above the range high or below the range low. Wick-only breakouts are ignored.
**4. Range Reset**
After a confirmed breakout, the existing levels remain visible.
A new reference candle is established only when a subsequent candle closes within the high-low range of its immediate predecessor.
The previous range is then automatically replaced.
### Key Features
- Automatic candle range detection
- Close-based breakout confirmation
- Dynamic high and low levels
- No wick-only breakout signals
- Levels remain active until a new valid range is established
- Customizable line colors and thickness
- Works directly on the selected chart timeframe
- No additional indicators or external data required
### Trading Applications
Dino Candle-Range BO provides a clean visual framework for analyzing price action, consolidation areas, and structural breakouts.
The identified levels can be used as additional context for:
- Breakout and reclaim setups
- Support and resistance analysis
- Market structure assessment
- Price action confirmation
The indicator is intended as a chart analysis tool and does not generate standalone buy or sell signals.
**Disclaimer:** This indicator is provided for educational and analytical purposes only and does not constitute financial advice.
---
*Developed by DinoTrading | Dino's Trading School*

Haftungsausschluss
Die Informationen und Veröffentlichungen sind nicht als Finanz-, Anlage-, Handels- oder andere Arten von Ratschlägen oder Empfehlungen gedacht, die von TradingView bereitgestellt oder gebilligt werden, und stellen diese nicht dar. Lesen Sie mehr in den Nutzungsbedingungen.
Haftungsausschluss
Die Informationen und Veröffentlichungen sind nicht als Finanz-, Anlage-, Handels- oder andere Arten von Ratschlägen oder Empfehlungen gedacht, die von TradingView bereitgestellt oder gebilligt werden, und stellen diese nicht dar. Lesen Sie mehr in den Nutzungsbedingungen.