Aktualisiert
COT Positioning with Measured Outcomes
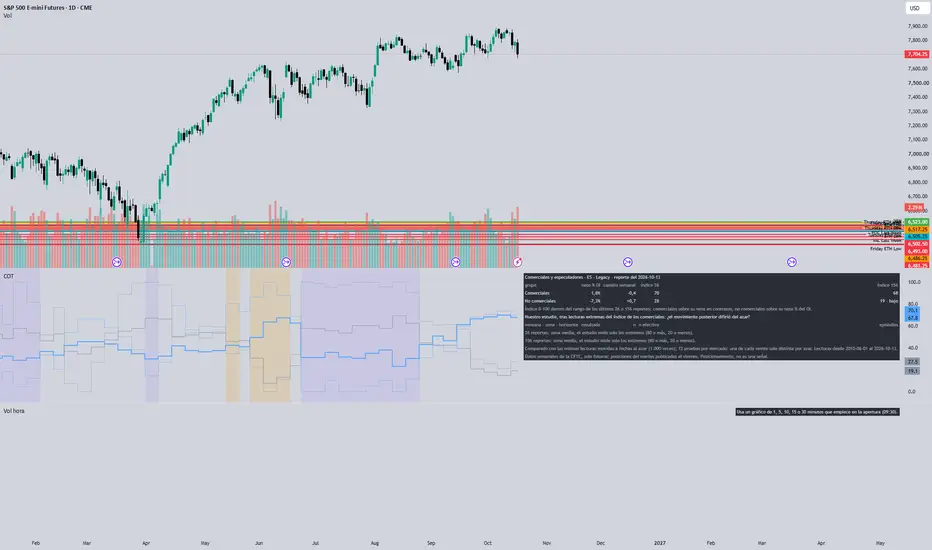
Weekly positioning of the main trader groups in the CFTC Commitments of Traders report, read on the chart through TradingView's COT library, with what our own study measured after similar readings in that same market.
WHAT IT SHOWS
- Financial futures (equity indices, rates, currencies, crypto): the Traders in Financial Futures report, leveraged funds and asset managers.
- Commodities (energy, metals, grains): the disaggregated report, managed money and producers/merchants.
- For each group: net position (long minus short) as a share of open interest, its weekly change, and a 0-100 index of where that net position sits inside its range of the last 156 reports (about three years). 80 and above is marked as an extreme high, 20 and below as an extreme low.
WHAT HAPPENED AFTER SIMILAR READINGS
For the main group, the table shows what our study measured in this market after readings in the same zone, 4, 13 and 26 weeks later: whether the market's later move differed from the same readings shifted to random dates (1,000 times), with the number of readings, the effective number once overlapping weeks are accounted for, and the number of separate episodes. Only the verdict is shown, never a return or its direction. In most markets the answer is igual al azar (no different from chance): an extreme reading has not been a usable signal by itself.
HOW TO READ IT
This is positioning, not a signal, and it does not suggest trades. The report gives positions as of Tuesday and is published on Friday; on the chart a report can appear on the Tuesday bar before it was public. Use a daily or weekly chart so 156 reports fit. The embedded study covers 30 futures markets and states up to which report it was measured; on other symbols the positions are still drawn when a CFTC code can be set in the settings. Labels and settings are in Spanish.
WHAT IT SHOWS
- Financial futures (equity indices, rates, currencies, crypto): the Traders in Financial Futures report, leveraged funds and asset managers.
- Commodities (energy, metals, grains): the disaggregated report, managed money and producers/merchants.
- For each group: net position (long minus short) as a share of open interest, its weekly change, and a 0-100 index of where that net position sits inside its range of the last 156 reports (about three years). 80 and above is marked as an extreme high, 20 and below as an extreme low.
WHAT HAPPENED AFTER SIMILAR READINGS
For the main group, the table shows what our study measured in this market after readings in the same zone, 4, 13 and 26 weeks later: whether the market's later move differed from the same readings shifted to random dates (1,000 times), with the number of readings, the effective number once overlapping weeks are accounted for, and the number of separate episodes. Only the verdict is shown, never a return or its direction. In most markets the answer is igual al azar (no different from chance): an extreme reading has not been a usable signal by itself.
HOW TO READ IT
This is positioning, not a signal, and it does not suggest trades. The report gives positions as of Tuesday and is published on Friday; on the chart a report can appear on the Tuesday bar before it was public. Use a daily or weekly chart so 156 reports fit. The embedded study covers 30 futures markets and states up to which report it was measured; on other symbols the positions are still drawn when a CFTC code can be set in the settings. Labels and settings are in Spanish.
Versionshinweise
New view (setting "Vista"): commercials and large speculators from the Legacy report. Commercials' net position (contracts) and non-commercials' net (% of open interest) as a 0-100 index over the last 26 reports (medium term) and 156 reports (long term), with extremes at 80 and 20 shaded. For commercials' extremes in this market, the table shows what our study measured 4, 13 and 26 weeks later for both windows, against the same readings at random dates: verdict, n, effective n and episodes, never a return or its direction. In ES, gold and crude oil almost every cell is igual al azar (no different from chance). The default view is unchanged. Positioning, not a signal.Versionshinweise
Alerts when the 156-report index of the main group (or the commercials in the Legacy view) enters the high extreme (80 or more), the low extreme (20 or less), or returns to the middle zone, on the bar of the new report. A change of zone, not a call; the table keeps what the study measured after those readings.
Perfiltrade — futures analysis with the sample in plain sight: historical base rates, Market Profile and COT across 30 instruments. No signals, no black boxes. perfiltrade.com
Haftungsausschluss
Die Informationen und Veröffentlichungen sind nicht als Finanz-, Anlage-, Handels- oder andere Arten von Ratschlägen oder Empfehlungen gedacht, die von TradingView bereitgestellt oder gebilligt werden, und stellen diese nicht dar. Lesen Sie mehr in den Nutzungsbedingungen.
Perfiltrade — futures analysis with the sample in plain sight: historical base rates, Market Profile and COT across 30 instruments. No signals, no black boxes. perfiltrade.com
Haftungsausschluss
Die Informationen und Veröffentlichungen sind nicht als Finanz-, Anlage-, Handels- oder andere Arten von Ratschlägen oder Empfehlungen gedacht, die von TradingView bereitgestellt oder gebilligt werden, und stellen diese nicht dar. Lesen Sie mehr in den Nutzungsbedingungen.