OPEN-SOURCE SCRIPT
Statistical Reversion Engine [JOAT]
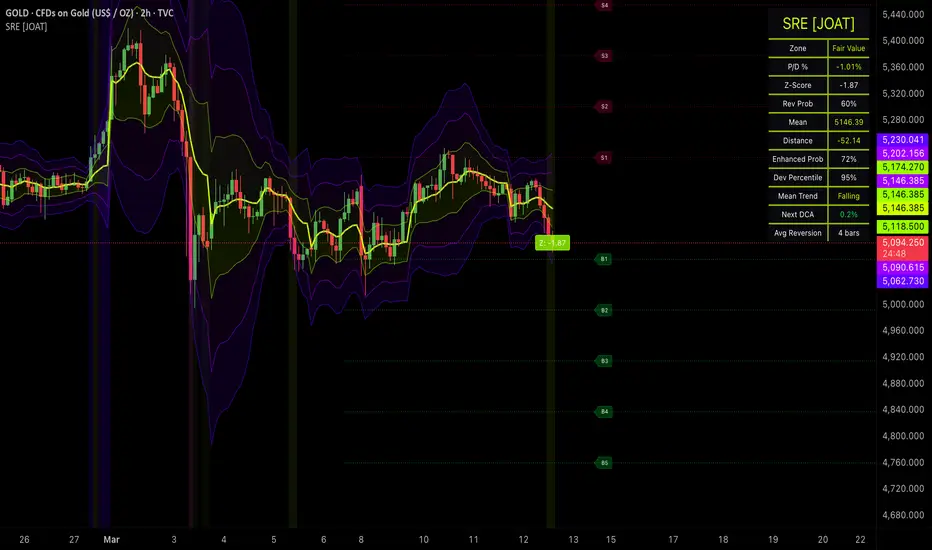
Statistical Reversion Engine [JOAT]
Introduction
The Statistical Reversion Engine (SRE) is an advanced open-source mean reversion indicator that combines statistical deviation bands, premium/discount zone analysis, DCA level calculation, Z-score measurement, and enhanced reversion probability scoring to identify high-probability mean reversion opportunities. This indicator quantifies price deviation from statistical mean using multiple calculation methods (SMA, EMA, VWAP, HMA) and provides probabilistic assessment of reversion likelihood through multi-factor analysis including deviation magnitude, volatility regime, and historical reversion patterns.
Unlike basic Bollinger Band indicators that simply plot standard deviation bands, SRE employs a sophisticated statistical framework that calculates Z-scores, premium/discount percentages, enhanced reversion probability (incorporating volatility and premium factors), and tracks historical reversion speed to provide traders with quantitative mean reversion intelligence. The indicator also generates DCA (Dollar Cost Averaging) levels with volatility-adjusted spacing for systematic position building.

Why This Indicator Exists
This indicator addresses the challenge of identifying when price has deviated sufficiently from mean to warrant mean reversion trades. Traditional mean reversion indicators lack probabilistic quantification and don't account for volatility regime or historical reversion patterns. SRE systematically reveals:
Each component provides unique intelligence. Mean calculation defines center, deviation bands show extremes, Z-score quantifies magnitude, premium/discount shows percentage, probability scores likelihood, DCA levels provide entry framework, and historical tracking provides context.
Core Components Explained
1. Flexible Mean Calculation System
SRE supports four mean calculation methods:
Pine Script®
Mean selection impacts reversion behavior:
- SMA: Simple average, slower to respond
- EMA: Exponential weighting, faster response
- VWAP: Volume-weighted, institutional reference
- HMA: Hull Moving Average, smoothest with minimal lag
2. Statistical Deviation Band System
Three deviation bands calculated using standard deviation:
Pine Script®
Default multipliers: 1.0, 2.0, 3.0 (customizable)
- 1σ: 68% of price action (normal range)
- 2σ: 95% of price action (extended range)
- 3σ: 99.7% of price action (extreme range)
3. Z-Score Calculation & Classification
Z-score quantifies deviation in standard deviation units:
Pine Script®
Z-score interpretation:
- |Z| < 1.0: Normal deviation (40% reversion probability)
- |Z| 1.0-1.5: Moderate deviation (60% reversion probability)
- |Z| 1.5-2.0: Extended deviation (75% reversion probability)
- |Z| 2.0-2.5: Extreme deviation (85% reversion probability)
- |Z| > 3.0: 3-sigma event (95% reversion probability)
4. Premium/Discount Zone Analysis
Percentage deviation from mean with zone classification:
Pine Script®
Zone classification (default thresholds):
- Extreme Premium: >3.0% above mean (strong sell zone)
- Premium: 1.5-3.0% above mean (sell zone)
- Fair Value: -1.5% to +1.5% (neutral zone)
- Discount: -3.0% to -1.5% below mean (buy zone)
- Extreme Discount: <-3.0% below mean (strong buy zone)
5. Enhanced Reversion Probability Scoring
Multi-factor probability calculation:
Pine Script®
Enhanced probability accounts for:
- Base Z-score probability
- Premium/discount magnitude (larger deviation = higher probability)
- Volatility regime (lower volatility = more predictable reversion)
6. Volatility-Adjusted DCA Level Generation
DCA levels automatically adjust spacing based on volatility:
Pine Script®
Volatility adjustment:
- High vol (ATR% >3): 1.5x spacing (wider levels)
- Elevated vol (ATR% 2-3): 1.2x spacing
- Normal vol (ATR% 1-2): 1.0x spacing (default)
- Low vol (ATR% <1): 0.8x spacing (tighter levels)
7. Historical Reversion Speed Tracking
Measures average bars to return to mean after extreme deviation:
Pine Script®
Average reversion time provides context for expected holding period.

Visual Elements
Input Parameters
Mean Calculation:
Deviation Bands:
Premium/Discount:
DCA Levels:
Visualization:
How to Use This Indicator
Step 1: Identify Current Zone
Check dashboard "Zone" row. Extreme Discount = strong buy zone, Extreme Premium = strong sell zone.
Step 2: Assess Z-Score Magnitude
|Z| >2.0 indicates extended deviation. |Z| >3.0 is 3-sigma event (rare, high reversion probability).
Step 3: Check Enhanced Reversion Probability
Dashboard shows enhanced probability accounting for volatility and premium factors. >80% is high probability.
Step 4: Monitor Mean Trend
"Rising" mean suggests uptrend, "Falling" suggests downtrend. Trade with mean trend for higher probability.
Step 5: Use DCA Levels for Entry
Enter positions at DCA levels (B1, B2, B3 for longs; S1, S2, S3 for shorts) to average into position.
Step 6: Wait for Strong Signals
Triangle markers appear when:
- Extreme zone + enhanced probability >80% + band crossover
- These are highest conviction mean reversion setups

Best Practices
Indicator Limitations
Technical Implementation
Built with Pine Script v6 using:
The code is fully open-source and can be modified to suit individual trading styles.
Originality Statement
This indicator is original in its comprehensive statistical mean reversion approach. While Bollinger Bands and mean reversion are established concepts, this indicator is justified because:
Each component contributes unique information: mean defines center, deviation bands show extremes, Z-score quantifies magnitude, premium/discount shows percentage, enhanced probability scores likelihood, DCA levels provide framework, historical tracking provides context, and mean trend shows direction. The indicator's value lies in presenting these complementary perspectives simultaneously with unified statistical framework.
Disclaimer
This indicator is provided for educational and informational purposes only. It is not financial advice. Mean reversion probabilities do not guarantee outcomes. Trading involves substantial risk of loss. Past performance does not guarantee future results. Always use proper risk management and never risk more than you can afford to lose.
-Made with passion by officialjackofalltrades
Introduction
The Statistical Reversion Engine (SRE) is an advanced open-source mean reversion indicator that combines statistical deviation bands, premium/discount zone analysis, DCA level calculation, Z-score measurement, and enhanced reversion probability scoring to identify high-probability mean reversion opportunities. This indicator quantifies price deviation from statistical mean using multiple calculation methods (SMA, EMA, VWAP, HMA) and provides probabilistic assessment of reversion likelihood through multi-factor analysis including deviation magnitude, volatility regime, and historical reversion patterns.
Unlike basic Bollinger Band indicators that simply plot standard deviation bands, SRE employs a sophisticated statistical framework that calculates Z-scores, premium/discount percentages, enhanced reversion probability (incorporating volatility and premium factors), and tracks historical reversion speed to provide traders with quantitative mean reversion intelligence. The indicator also generates DCA (Dollar Cost Averaging) levels with volatility-adjusted spacing for systematic position building.
Why This Indicator Exists
This indicator addresses the challenge of identifying when price has deviated sufficiently from mean to warrant mean reversion trades. Traditional mean reversion indicators lack probabilistic quantification and don't account for volatility regime or historical reversion patterns. SRE systematically reveals:
- Multiple Mean Calculations: SMA, EMA, VWAP (session/continuous), HMA for flexible mean definition
- Statistical Deviation Bands: 1σ, 2σ, 3σ bands with customizable multipliers
- Z-Score Calculation: Quantifies deviation in standard deviation units
- Premium/Discount Analysis: Percentage deviation from mean with zone classification
- Enhanced Reversion Probability: Multi-factor scoring (Z-score + premium + volatility)
- DCA Level Generation: Volatility-adjusted levels for systematic position building
- Historical Reversion Tracking: Measures average bars to return to mean after extreme deviation
Each component provides unique intelligence. Mean calculation defines center, deviation bands show extremes, Z-score quantifies magnitude, premium/discount shows percentage, probability scores likelihood, DCA levels provide entry framework, and historical tracking provides context.
Core Components Explained
1. Flexible Mean Calculation System
SRE supports four mean calculation methods:
Mean selection impacts reversion behavior:
- SMA: Simple average, slower to respond
- EMA: Exponential weighting, faster response
- VWAP: Volume-weighted, institutional reference
- HMA: Hull Moving Average, smoothest with minimal lag
2. Statistical Deviation Band System
Three deviation bands calculated using standard deviation:
Default multipliers: 1.0, 2.0, 3.0 (customizable)
- 1σ: 68% of price action (normal range)
- 2σ: 95% of price action (extended range)
- 3σ: 99.7% of price action (extreme range)
3. Z-Score Calculation & Classification
Z-score quantifies deviation in standard deviation units:
Z-score interpretation:
- |Z| < 1.0: Normal deviation (40% reversion probability)
- |Z| 1.0-1.5: Moderate deviation (60% reversion probability)
- |Z| 1.5-2.0: Extended deviation (75% reversion probability)
- |Z| 2.0-2.5: Extreme deviation (85% reversion probability)
- |Z| > 3.0: 3-sigma event (95% reversion probability)
4. Premium/Discount Zone Analysis
Percentage deviation from mean with zone classification:
Zone classification (default thresholds):
- Extreme Premium: >3.0% above mean (strong sell zone)
- Premium: 1.5-3.0% above mean (sell zone)
- Fair Value: -1.5% to +1.5% (neutral zone)
- Discount: -3.0% to -1.5% below mean (buy zone)
- Extreme Discount: <-3.0% below mean (strong buy zone)
5. Enhanced Reversion Probability Scoring
Multi-factor probability calculation:
Enhanced probability accounts for:
- Base Z-score probability
- Premium/discount magnitude (larger deviation = higher probability)
- Volatility regime (lower volatility = more predictable reversion)
6. Volatility-Adjusted DCA Level Generation
DCA levels automatically adjust spacing based on volatility:
Volatility adjustment:
- High vol (ATR% >3): 1.5x spacing (wider levels)
- Elevated vol (ATR% 2-3): 1.2x spacing
- Normal vol (ATR% 1-2): 1.0x spacing (default)
- Low vol (ATR% <1): 0.8x spacing (tighter levels)
7. Historical Reversion Speed Tracking
Measures average bars to return to mean after extreme deviation:
Average reversion time provides context for expected holding period.
Visual Elements
- Mean Line: Electric lime line showing statistical mean
- Deviation Bands: 1σ (lime), 2σ (violet), 3σ (deep violet) with gradient fills
- Premium/Discount Zones: Background coloring (violet for premium, lime for discount)
- DCA Levels: Dotted lines with "B1, B2, B3..." (buy) and "S1, S2, S3..." (sell) labels
- Z-Score Label: Current Z-score displayed on price
- Gradient Zone Fills: Progressive transparency between bands
- Mean Reversion Signals: Triangle markers for strong buy/sell setups
- Reversion Probability Heatmap: Background intensity based on enhanced probability
- Dashboard: Real-time metrics including zone, P/D%, Z-score, reversion probability, mean value, distance, enhanced probability, deviation percentile, mean trend, nearest DCA, average reversion time, bars since extreme
Input Parameters
Mean Calculation:
- Mean Type: SMA, EMA, VWAP, HMA (default: VWAP)
- Mean Length: Period for mean calculation (default: 20)
- Session Reset (VWAP): Toggle session anchoring (default: true)
Deviation Bands:
- Band 1 Multiplier: 1σ multiplier (default: 1.0)
- Band 2 Multiplier: 2σ multiplier (default: 2.0)
- Band 3 Multiplier: 3σ multiplier (default: 3.0)
- Deviation Period: Standard deviation calculation period (default: 20)
Premium/Discount:
- Premium Threshold (%): Threshold for premium zone (default: 1.5%)
- Discount Threshold (%): Threshold for discount zone (default: -1.5%)
DCA Levels:
- Enable DCA Levels: Toggle DCA display (default: true)
- Number of DCA Levels: Levels to generate (default: 5)
- DCA Spacing (%): Base spacing between levels (default: 1.5%)
Visualization:
- Show Deviation Bands: Toggle band display (default: true)
- Show Band Fills: Toggle gradient fills (default: true)
- Show Premium/Discount Zones: Toggle background coloring (default: true)
- Show Z-Score Label: Toggle Z-score display (default: true)
How to Use This Indicator
Step 1: Identify Current Zone
Check dashboard "Zone" row. Extreme Discount = strong buy zone, Extreme Premium = strong sell zone.
Step 2: Assess Z-Score Magnitude
|Z| >2.0 indicates extended deviation. |Z| >3.0 is 3-sigma event (rare, high reversion probability).
Step 3: Check Enhanced Reversion Probability
Dashboard shows enhanced probability accounting for volatility and premium factors. >80% is high probability.
Step 4: Monitor Mean Trend
"Rising" mean suggests uptrend, "Falling" suggests downtrend. Trade with mean trend for higher probability.
Step 5: Use DCA Levels for Entry
Enter positions at DCA levels (B1, B2, B3 for longs; S1, S2, S3 for shorts) to average into position.
Step 6: Wait for Strong Signals
Triangle markers appear when:
- Extreme zone + enhanced probability >80% + band crossover
- These are highest conviction mean reversion setups
Best Practices
- Mean reversion works best in ranging markets - avoid strong trends
- 3-sigma events (|Z| >3.0) have highest reversion probability but occur rarely
- Use DCA levels to build positions systematically rather than all-in entries
- Enhanced probability >80% indicates high-quality setup
- Mean trend provides context - reversion against trend is lower probability
- Volatility-adjusted DCA spacing prevents over-concentration in high vol
- Average reversion time helps set realistic profit target timeframes
- Combine with higher timeframe trend - mean reversion with trend is safer
- Deviation percentile >90% indicates extreme deviation
- Bars since extreme >50 suggests extended deviation may persist
Indicator Limitations
- Mean reversion fails during strong trending markets
- 3-sigma events can persist longer than expected during major news
- DCA levels don't account for fundamental catalysts
- Enhanced probability is statistical, not deterministic
- Historical reversion time doesn't guarantee future reversion speed
- VWAP mean resets daily - may not be appropriate for all timeframes
- Standard deviation assumes normal distribution - markets have fat tails
- Premium/discount thresholds may need adjustment for different instruments
Technical Implementation
Built with Pine Script v6 using:
- Four mean calculation methods (SMA, EMA, VWAP, HMA)
- Three-tier deviation band system with customizable multipliers
- Z-score calculation with standard deviation
- Premium/discount percentage with zone classification
- Enhanced reversion probability (Z-score + premium + volatility)
- Volatility-adjusted DCA level generation
- Historical reversion speed tracking with arrays
- Deviation percentile ranking
- Mean trend detection (fast vs slow mean)
- Gradient zone fills with progressive transparency
- Reversion probability heatmap background
- Comprehensive dashboard with 12 metrics
The code is fully open-source and can be modified to suit individual trading styles.
Originality Statement
This indicator is original in its comprehensive statistical mean reversion approach. While Bollinger Bands and mean reversion are established concepts, this indicator is justified because:
- It combines four mean calculation methods with three-tier deviation bands
- Enhanced reversion probability incorporates Z-score, premium magnitude, and volatility regime
- Volatility-adjusted DCA level generation adapts to market conditions
- Historical reversion speed tracking provides empirical context
- Premium/discount zone classification adds percentage-based perspective
- Mean trend detection (fast vs slow) provides directional context
- Deviation percentile ranking shows historical extremity
- Integration of statistical measures (Z-score, stdev, percentile) with practical tools (DCA levels, signals)
Each component contributes unique information: mean defines center, deviation bands show extremes, Z-score quantifies magnitude, premium/discount shows percentage, enhanced probability scores likelihood, DCA levels provide framework, historical tracking provides context, and mean trend shows direction. The indicator's value lies in presenting these complementary perspectives simultaneously with unified statistical framework.
Disclaimer
This indicator is provided for educational and informational purposes only. It is not financial advice. Mean reversion probabilities do not guarantee outcomes. Trading involves substantial risk of loss. Past performance does not guarantee future results. Always use proper risk management and never risk more than you can afford to lose.
-Made with passion by officialjackofalltrades
Open-source Skript
Ganz im Sinne von TradingView hat dieser Autor sein/ihr Script als Open-Source veröffentlicht. Auf diese Weise können nun auch andere Trader das Script rezensieren und die Funktionalität überprüfen. Vielen Dank an den Autor! Sie können das Script kostenlos verwenden, aber eine Wiederveröffentlichung des Codes unterliegt unseren Hausregeln.

The Institutional Grade Trading Ecosystem, Built to win trades 📈
Get Access 👇
jackofalltrades.vip 🌐
t.me/jackofalltradesvip 🃏
Get Access 👇
jackofalltrades.vip 🌐
t.me/jackofalltradesvip 🃏
Haftungsausschluss
Die Informationen und Veröffentlichungen sind nicht als Finanz-, Anlage-, Handels- oder andere Arten von Ratschlägen oder Empfehlungen gedacht, die von TradingView bereitgestellt oder gebilligt werden, und stellen diese nicht dar. Lesen Sie mehr in den Nutzungsbedingungen.
Open-source Skript
Ganz im Sinne von TradingView hat dieser Autor sein/ihr Script als Open-Source veröffentlicht. Auf diese Weise können nun auch andere Trader das Script rezensieren und die Funktionalität überprüfen. Vielen Dank an den Autor! Sie können das Script kostenlos verwenden, aber eine Wiederveröffentlichung des Codes unterliegt unseren Hausregeln.
The Institutional Grade Trading Ecosystem, Built to win trades 📈
Get Access 👇
jackofalltrades.vip 🌐
t.me/jackofalltradesvip 🃏
Get Access 👇
jackofalltrades.vip 🌐
t.me/jackofalltradesvip 🃏
Haftungsausschluss
Die Informationen und Veröffentlichungen sind nicht als Finanz-, Anlage-, Handels- oder andere Arten von Ratschlägen oder Empfehlungen gedacht, die von TradingView bereitgestellt oder gebilligt werden, und stellen diese nicht dar. Lesen Sie mehr in den Nutzungsbedingungen.