HS SP500 1.6x Long Benchmark
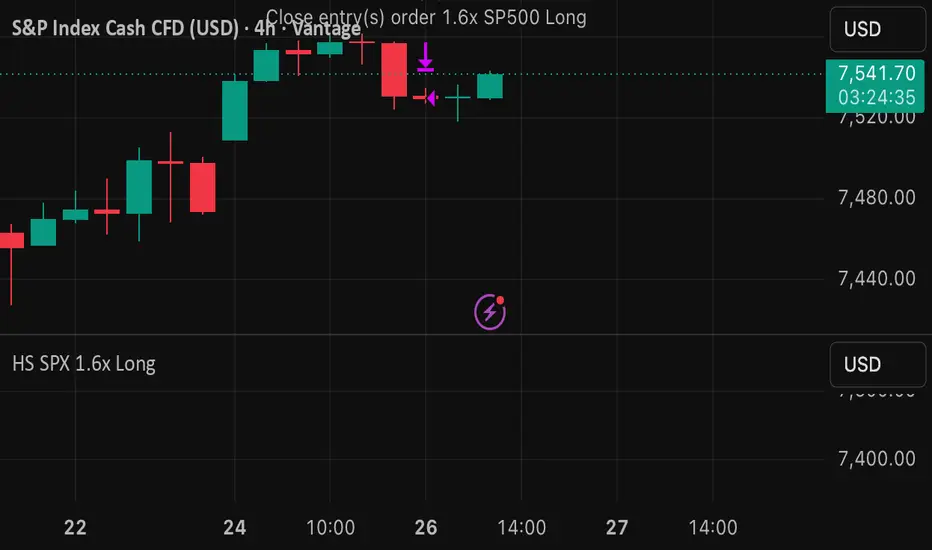
Long-only SP500 benchmark strategy using 160% notional exposure.
This is not a predictive trading signal. It is a transparent leveraged benchmark designed to compare 1.6x long SP500 exposure against TradingView’s Buy & Hold benchmark over the same historical window.
Backtest target used:
VANTAGE:SP500, 4h, Mar 16, 2018 to May 26, 2026.
The strategy models:
160% of equity position sizing, 0.075% commission, 2 ticks slippage, and 50% long margin.
Expected behavior: if applied to the same SP500 chart and date window, it should outperform 1x Buy & Hold by roughly the leverage factor, while also carrying larger drawdowns and margin risk.

Haftungsausschluss
Die Informationen und Veröffentlichungen sind nicht als Finanz-, Anlage-, Handels- oder andere Arten von Ratschlägen oder Empfehlungen gedacht, die von TradingView bereitgestellt oder gebilligt werden, und stellen diese nicht dar. Lesen Sie mehr in den Nutzungsbedingungen.
Haftungsausschluss
Die Informationen und Veröffentlichungen sind nicht als Finanz-, Anlage-, Handels- oder andere Arten von Ratschlägen oder Empfehlungen gedacht, die von TradingView bereitgestellt oder gebilligt werden, und stellen diese nicht dar. Lesen Sie mehr in den Nutzungsbedingungen.