OPEN-SOURCE SCRIPT
Aktualisiert Sheabot Relative Volume and Range
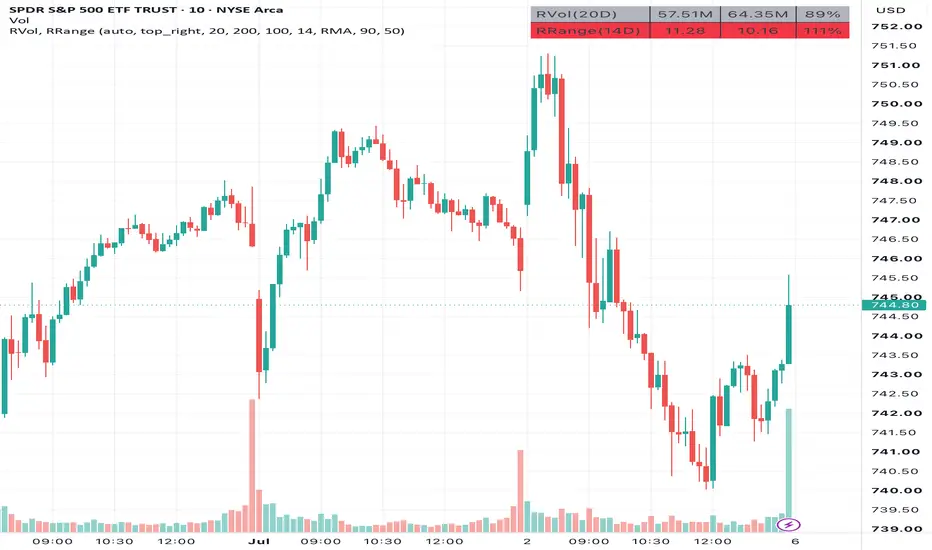
Display a combined table showing relative volume and relative range (also known as Daily True Range vs Average True Range) on all timeframes. The table rows change colors based on the relative volume and relative range values. The values and colors can be configured.
These indicators are combined together for a more efficient display in the same location. These indicators also commonly move together. A low relative volume will also likely have a low relative range. A high relative volume may accompany the price breaking out past the average range and a relative range over 100%. The relative range can also help set price targets. If the relative range is less than 100%, then the stock has not yet moved to its average range.
These concepts are used and inspired by the great @ripster47.
Relative Volume
Relative Range
These indicators are combined together for a more efficient display in the same location. These indicators also commonly move together. A low relative volume will also likely have a low relative range. A high relative volume may accompany the price breaking out past the average range and a relative range over 100%. The relative range can also help set price targets. If the relative range is less than 100%, then the stock has not yet moved to its average range.
These concepts are used and inspired by the great @ripster47.
Relative Volume
- Table displays current volume, average volume, and relative volume as a percent of current volume / average volume over the timeframe.
- When the timeframe is 1D or less, then the current volume is the volume for the day so far, and the average volume is calculated over the past bar length days.
- When the timeframe is greater than 1D, then the current volume is the volume for the week/month/year so far, and the average volume is calculated over the past bar length weeks/months/years.
- High Percent: Default is 100. Relative volume below this is considered low and the table row is colored grey. Relative volume above this is considered high and the table row is colored yellow.
- Unusual Percent. Default is 200. Relative volume above this is considered unusual and the table row is colored green.
Relative Range
- Table displays daily true range (DTR), average true range (ATR), and relative range as a percent of DTR / ATR over the timeframe.
- When the timeframe is 1D or less, then the daily true range is the difference between the high and low price since open, and the average true range is calculated over the past bar length days.
- When the timeframe is greater than 1D, then the daily true range is the difference between the high and low price for the past week/month/year, and the average true range is calculated over the past bar length weeks/months/years.
- Normal Percent: Default is 50. Relative range below this is considered low and the table row is colored grey. Relative range above this is considered normal and the table row is colored yellow.
- High Percent. Default is 90. Relative range above this is considered high and the table row is colored red.
Versionshinweise
Update chart with just this indicator. Update Relative Volume Length default value.Open-source Skript
Ganz im Sinne von TradingView hat dieser Autor sein/ihr Script als Open-Source veröffentlicht. Auf diese Weise können nun auch andere Trader das Script rezensieren und die Funktionalität überprüfen. Vielen Dank an den Autor! Sie können das Script kostenlos verwenden, aber eine Wiederveröffentlichung des Codes unterliegt unseren Hausregeln.

Haftungsausschluss
Die Informationen und Veröffentlichungen sind nicht als Finanz-, Anlage-, Handels- oder andere Arten von Ratschlägen oder Empfehlungen gedacht, die von TradingView bereitgestellt oder gebilligt werden, und stellen diese nicht dar. Lesen Sie mehr in den Nutzungsbedingungen.
Open-source Skript
Ganz im Sinne von TradingView hat dieser Autor sein/ihr Script als Open-Source veröffentlicht. Auf diese Weise können nun auch andere Trader das Script rezensieren und die Funktionalität überprüfen. Vielen Dank an den Autor! Sie können das Script kostenlos verwenden, aber eine Wiederveröffentlichung des Codes unterliegt unseren Hausregeln.
Haftungsausschluss
Die Informationen und Veröffentlichungen sind nicht als Finanz-, Anlage-, Handels- oder andere Arten von Ratschlägen oder Empfehlungen gedacht, die von TradingView bereitgestellt oder gebilligt werden, und stellen diese nicht dar. Lesen Sie mehr in den Nutzungsbedingungen.