Zones min | jjart
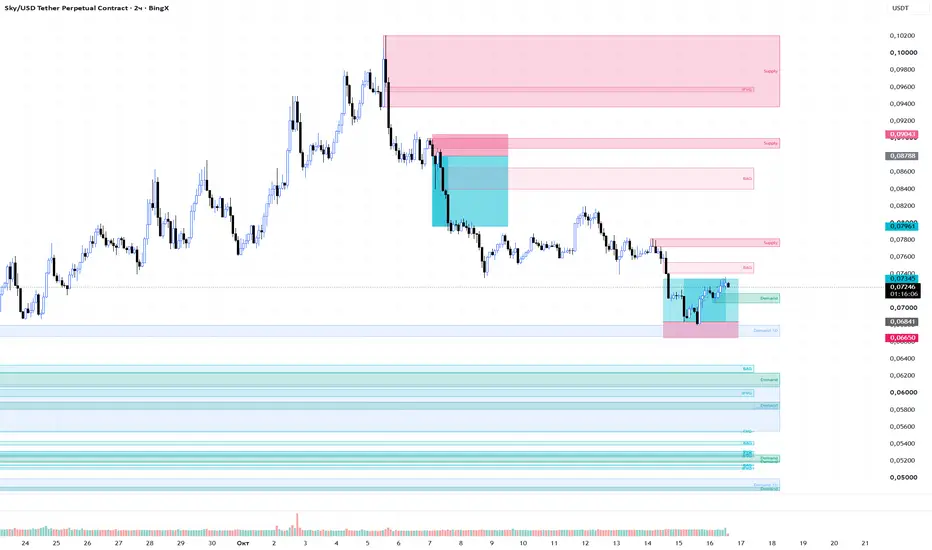
Supply Demand + Imbalances Mini
A focused chart overlay for supply and demand zones, fair value gaps, imbalance clusters, and inverse fair value gaps. It combines local zones with optional 1-hour and daily supply/demand context in a single display.
HOW ZONES ARE BUILT
Demand starts with a bearish origin candle followed by 2 to 10 consecutive bullish or doji candles. The final candle in the sequence must close above the origin candle's open, without an earlier candle in that sequence already completing the same break. The zone extends from the origin open down to the lowest wick in the pattern. Supply uses the mirrored rules.
FVG detection uses a three-candle price gap with an additional middle-candle high/low condition. Gap size is filtered against the 200-bar standard deviation of the corresponding raw gap series. A gap receives the BAG label when the detection candle also closes beyond the middle candle's high for a bullish gap, or below its low for a bearish gap.
Overlapping gaps in the same direction can merge into a cluster when their overlap covers at least half the smaller gap. The combined range must not exceed four times the 14-bar ATR. The cluster label counts the gaps combined into that zone; this count is not a strength score.
An imbalance broken by a closing price can remain eligible for inversion for up to 8 chart bars. An iFVG forms only when a new opposing gap overlaps it by at least 25% of the smaller range. The resulting zone is their intersection. A closing-price break alone does not create an iFVG.
ZONE LIFECYCLE
Supply and demand zones are removed when a confirmed candle's wick moves beyond their far boundary. Imbalances are removed when price closes beyond their far boundary or their maximum fill reaches the selected threshold, which defaults to 65%.
The unfilled-portion setting progressively trims the visible zone as price trades into it. Original boundaries remain the basis for fill and invalidation calculations. Clusters can expand when new qualifying gaps are added.
Zones expire after 1,500 chart bars from creation. The active-zone limit also removes older entries when necessary.
HIGHER TIMEFRAMES AND TIMING
Optional 1H and 1D supply/demand patterns are calculated on their own source timeframes and displayed only on lower chart timeframes.
Zone creation, fill updates, and invalidation are committed at chart-bar close. Supply/demand detection uses completed candles and becomes available on the following chart candle's close. Higher-timeframe detection also uses completed source candles.
Boxes extend back to the pattern's origin for visual context. This does not mean the zone was known at that earlier candle. This script shows active zones rather than a permanent history of every past setup, so historical screenshots should not be treated as a record of signals available at each moment.
PRACTICAL TIPS
For a cleaner chart, raise Minimum imbalance size from 0.2 to 0.4 or 0.6. This filters out smaller gaps relative to the same 200-bar gap-size history. Lower values show more gaps.
Turn off Show only the unfilled portion when you want to inspect the original zone boundaries. Turn it on when you want the chart to emphasize what remains unfilled. The deletion rules stay the same in both modes.
To compare individual gaps with combined areas, temporarily disable cluster merging. This helps explain why a cluster's boundaries expanded and why its label count increased.
On lower timeframes, disable either the 1H or 1D layer if overlapping boxes make the chart difficult to read. Each layer has its own color settings.
DEFAULT COLORS
Local demand: green. Local supply: pink.
Higher-timeframe demand: light blue. Higher-timeframe supply: purple.
Bullish imbalances: cyan. Bearish imbalances: light pink.
This is a visual analysis indicator. It does not place orders, generate trade alerts, or provide webhook messages. A zone marks a price pattern, not a guaranteed reaction or an entry instruction.
A focused chart overlay for supply and demand zones, fair value gaps, imbalance clusters, and inverse fair value gaps. It combines local zones with optional 1-hour and daily supply/demand context in a single display.
HOW ZONES ARE BUILT
Demand starts with a bearish origin candle followed by 2 to 10 consecutive bullish or doji candles. The final candle in the sequence must close above the origin candle's open, without an earlier candle in that sequence already completing the same break. The zone extends from the origin open down to the lowest wick in the pattern. Supply uses the mirrored rules.
FVG detection uses a three-candle price gap with an additional middle-candle high/low condition. Gap size is filtered against the 200-bar standard deviation of the corresponding raw gap series. A gap receives the BAG label when the detection candle also closes beyond the middle candle's high for a bullish gap, or below its low for a bearish gap.
Overlapping gaps in the same direction can merge into a cluster when their overlap covers at least half the smaller gap. The combined range must not exceed four times the 14-bar ATR. The cluster label counts the gaps combined into that zone; this count is not a strength score.
An imbalance broken by a closing price can remain eligible for inversion for up to 8 chart bars. An iFVG forms only when a new opposing gap overlaps it by at least 25% of the smaller range. The resulting zone is their intersection. A closing-price break alone does not create an iFVG.
ZONE LIFECYCLE
Supply and demand zones are removed when a confirmed candle's wick moves beyond their far boundary. Imbalances are removed when price closes beyond their far boundary or their maximum fill reaches the selected threshold, which defaults to 65%.
The unfilled-portion setting progressively trims the visible zone as price trades into it. Original boundaries remain the basis for fill and invalidation calculations. Clusters can expand when new qualifying gaps are added.
Zones expire after 1,500 chart bars from creation. The active-zone limit also removes older entries when necessary.
HIGHER TIMEFRAMES AND TIMING
Optional 1H and 1D supply/demand patterns are calculated on their own source timeframes and displayed only on lower chart timeframes.
Zone creation, fill updates, and invalidation are committed at chart-bar close. Supply/demand detection uses completed candles and becomes available on the following chart candle's close. Higher-timeframe detection also uses completed source candles.
Boxes extend back to the pattern's origin for visual context. This does not mean the zone was known at that earlier candle. This script shows active zones rather than a permanent history of every past setup, so historical screenshots should not be treated as a record of signals available at each moment.
PRACTICAL TIPS
For a cleaner chart, raise Minimum imbalance size from 0.2 to 0.4 or 0.6. This filters out smaller gaps relative to the same 200-bar gap-size history. Lower values show more gaps.
Turn off Show only the unfilled portion when you want to inspect the original zone boundaries. Turn it on when you want the chart to emphasize what remains unfilled. The deletion rules stay the same in both modes.
To compare individual gaps with combined areas, temporarily disable cluster merging. This helps explain why a cluster's boundaries expanded and why its label count increased.
On lower timeframes, disable either the 1H or 1D layer if overlapping boxes make the chart difficult to read. Each layer has its own color settings.
DEFAULT COLORS
Local demand: green. Local supply: pink.
Higher-timeframe demand: light blue. Higher-timeframe supply: purple.
Bullish imbalances: cyan. Bearish imbalances: light pink.
This is a visual analysis indicator. It does not place orders, generate trade alerts, or provide webhook messages. A zone marks a price pattern, not a guaranteed reaction or an entry instruction.

Haftungsausschluss
Die Informationen und Veröffentlichungen sind nicht als Finanz-, Anlage-, Handels- oder andere Arten von Ratschlägen oder Empfehlungen gedacht, die von TradingView bereitgestellt oder gebilligt werden, und stellen diese nicht dar. Lesen Sie mehr in den Nutzungsbedingungen.
Haftungsausschluss
Die Informationen und Veröffentlichungen sind nicht als Finanz-, Anlage-, Handels- oder andere Arten von Ratschlägen oder Empfehlungen gedacht, die von TradingView bereitgestellt oder gebilligt werden, und stellen diese nicht dar. Lesen Sie mehr in den Nutzungsbedingungen.