Aktualisiert
Macro Ranges+ (M1D)
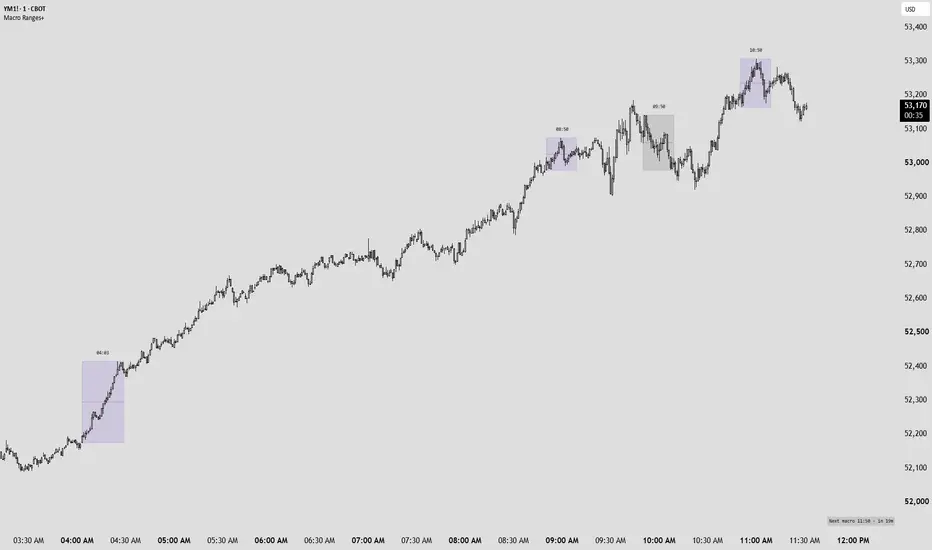
Macro Ranges+
Boxes each ICT macro window around the range price actually made inside it. No full-height strip: the box runs from the window's first candle to its last, from its high to its low, and grows live while the macro is open.
The windows
ICT list (default).
New York time: 02:33-03:00, 04:03-04:30, 08:50-09:10, 09:50-10:10, 10:50-11:10, 11:50-12:10, 13:10-13:40 and 15:15-15:45, plus the Asia macros from 18:50-19:10 through 23:50-00:10. The last Asia macro runs past midnight and is drawn as one box.

Every hour. XX:50 to XX+1:10, round the clock.

The ICT macro times are an established Inner Circle Trader concept. This script is original in its implementation of them.
What it draws
The range box.
Blue when the macro closed above its open, red when below, or one neutral grey. No edge by default, so the fill alone shows the range. A light dotted or a solid edge can be switched on.
The midpoint.
A dotted line across the box at the middle of the macro's range (CE).
The time.
The macro's open time sits above the box. Hover it for the high, low and range in points.
High and low until taken. Optional. After the macro closes, its high and low run right as dotted lines until price trades through them.
The next macro chip.
A small card, bottom right by default: the macro running now and the minutes it has left, or the next one and how long until it opens. It reads the clock, not the last bar, so the countdown is right between bars, and it shows "Market closed" when no bar has printed for over 30 minutes.
Method
A bar belongs to the window it overlaps, so the box is right on 1m to 5m charts. A macro is 20 to 30 minutes, so the boxes only draw up to a chosen timeframe (5 minutes by default) and stay off on higher ones. History is kept for 3 days by default (up to 30). While a macro is open its box, colour and midpoint update with price; once it closes, it is fixed.
Settings
Macros: ICT list or every hour, the highest chart timeframe, and the days of history.
Drawing: colour (direction or grey), fill transparency, midpoint, extend high / low, the time above the box, text size and the box edge (none, dotted or solid).
Next macro chip: on or off, and its position.
Analytics only
This is a study tool. It marks where each macro traded and how far it ranged. It contains no buy or sell signals and no alerts.
Disclaimer
This is a decision-support tool for discretionary ICT trading. It is not financial advice, and no market's past behaviour is indicative of future results.
Boxes each ICT macro window around the range price actually made inside it. No full-height strip: the box runs from the window's first candle to its last, from its high to its low, and grows live while the macro is open.
The windows
ICT list (default).
New York time: 02:33-03:00, 04:03-04:30, 08:50-09:10, 09:50-10:10, 10:50-11:10, 11:50-12:10, 13:10-13:40 and 15:15-15:45, plus the Asia macros from 18:50-19:10 through 23:50-00:10. The last Asia macro runs past midnight and is drawn as one box.
Every hour. XX:50 to XX+1:10, round the clock.
The ICT macro times are an established Inner Circle Trader concept. This script is original in its implementation of them.
What it draws
The range box.
Blue when the macro closed above its open, red when below, or one neutral grey. No edge by default, so the fill alone shows the range. A light dotted or a solid edge can be switched on.
The midpoint.
A dotted line across the box at the middle of the macro's range (CE).
The time.
The macro's open time sits above the box. Hover it for the high, low and range in points.
High and low until taken. Optional. After the macro closes, its high and low run right as dotted lines until price trades through them.
The next macro chip.
A small card, bottom right by default: the macro running now and the minutes it has left, or the next one and how long until it opens. It reads the clock, not the last bar, so the countdown is right between bars, and it shows "Market closed" when no bar has printed for over 30 minutes.
Method
A bar belongs to the window it overlaps, so the box is right on 1m to 5m charts. A macro is 20 to 30 minutes, so the boxes only draw up to a chosen timeframe (5 minutes by default) and stay off on higher ones. History is kept for 3 days by default (up to 30). While a macro is open its box, colour and midpoint update with price; once it closes, it is fixed.
Settings
Macros: ICT list or every hour, the highest chart timeframe, and the days of history.
Drawing: colour (direction or grey), fill transparency, midpoint, extend high / low, the time above the box, text size and the box edge (none, dotted or solid).
Next macro chip: on or off, and its position.
Analytics only
This is a study tool. It marks where each macro traded and how far it ranged. It contains no buy or sell signals and no alerts.
Disclaimer
This is a decision-support tool for discretionary ICT trading. It is not financial advice, and no market's past behaviour is indicative of future results.
Versionshinweise
Fixed: runtime error on stocks and ETFsOn some charts the script stopped with "Cannot call last() if array is empty". It happened when every macro on the chart had passed the History setting at once, which is what a stock or ETF sees on Monday morning before its first macro of the day (futures never hit it, the Sunday evening Asia macros keep one in range). The script now carries on with nothing to update instead of stopping. Tested on SPY 5m.
Clearer on higher timeframes
A macro is a 20 to 30 minute window, so the boxes only draw on charts at or below the "Highest chart timeframe" setting (5m by default). Above it, the chart used to stay blank with no reason given. The small card in the corner now reads "Macros draw on 5m charts or lower" (it follows your setting). Boxes, colours, midpoints and all settings are unchanged.

Haftungsausschluss
Die Informationen und Veröffentlichungen sind nicht als Finanz-, Anlage-, Handels- oder andere Arten von Ratschlägen oder Empfehlungen gedacht, die von TradingView bereitgestellt oder gebilligt werden, und stellen diese nicht dar. Lesen Sie mehr in den Nutzungsbedingungen.
Haftungsausschluss
Die Informationen und Veröffentlichungen sind nicht als Finanz-, Anlage-, Handels- oder andere Arten von Ratschlägen oder Empfehlungen gedacht, die von TradingView bereitgestellt oder gebilligt werden, und stellen diese nicht dar. Lesen Sie mehr in den Nutzungsbedingungen.